
See exactly how much room your account gives you
ExploreOvertrading is taking more trades than your strategy actually calls for, usually out of boredom, frustration or the urge to stay busy. It hurts in two ways: every extra trade pays a spread or commission whether it works or not, and every extra trade is another decision made with less care than the last. The fix is not more willpower but fewer, pre-defined trades and limits that do not move.
Our trading psychology guide introduces overtrading as the most common psychological leak. This article goes deeper: the cost arithmetic, the warning signs, a journal self-audit and the limits that stop it.
Quick answer: Overtrading is trading more often, or with more size, than a written trading plan justifies, typically driven by boredom, losses, fear of missing out or platform prompts. Overtrading raises fixed costs per trade, lowers average setup quality and turns a small statistical edge into a net loss. Traders stop overtrading with daily trade caps, A-setups only and fixed session windows.
Highlights of this article
- Costs scale with activity, not skill: at 6 USD per round trip, 30 trades a day costs 3,780 USD a month before a single winner
- An edge of 0.1R per trade disappears completely once costs are larger than that edge
- The classic signs are boredom trades, drifting to lower timeframes, more trades after losses and trading outside your planned sessions
- A trading journal with setup tags and a trades-per-day column shows exactly where overtrading costs you
- Hard limits work better than intentions: a daily trade cap, A-setups only, set session windows and a higher timeframe
Funded accounts
Ready to get funded?
Trade up to $200,000 in firm capital with static drawdown, no consistency rule, and payouts within 24 hours. Pass the challenge and keep up to 90% of your profits.
Get funded from $40What is overtrading in trading?
Overtrading is any trading activity beyond what your plan's setups, risk rules and schedule actually produce. If your strategy produces two valid signals a day and you take eight trades, the extra six are overtrading, even if some of them win.
Overtrading takes two forms:
- Frequency overtrading: too many trades, often small and fast, taken because the screen is open.
- Size overtrading: positions larger than your risk management rules allow, often to "make back" a loss quickly. This overlaps with revenge trading.
Both start with how you feel, not what the market shows.
| Item | Detail |
|---|---|
| Definition | Taking more trades, or larger trades, than your written plan justifies |
| Rule of thumb | If you cannot name the setup before entry, the trade is probably overtrading |
| Worked example | A 0.1R edge on a 50 USD risk is 5 USD per trade; 6 USD of costs turns it into a 1 USD loss per trade |
| When it matters | Short timeframes, high-fee instruments, after losing streaks, during quiet sessions |
| Main risk | Costs and low-quality setups slowly turn a positive edge negative |
| Related terms | FOMO trading, revenge trading, scalping, trading costs, expectancy |
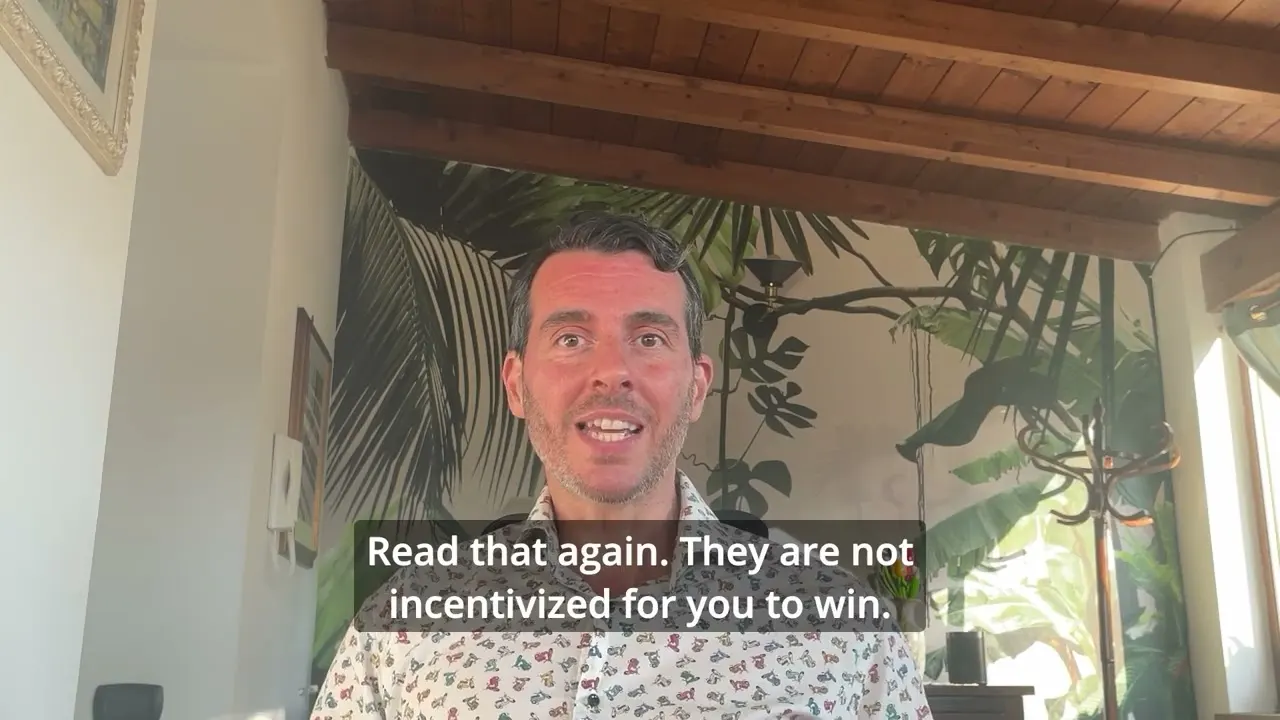
Gianluca Pizzituti on trading too much
 3:00
3:00Read the transcript
Here is something nobody in this industry will ever tell you. You are trading too much, and it is quietly killing your account.
I am Gianluca Pizzituti, CEO of Velotrade. I've been trading for over 25 years, institutionally and privately. And what I'm about to say goes against almost everything you've been sold.
Open any feed and it is the same message on repeat. You can trade, you can become a trader, you can make money, you can build a career out of this. And look, all of that can be true. I'm not here to crush the dream. But there is a part of the story nobody mentions.
The whole machine is built to make you trade more. Not better. More.
Think about who is on the other side of all the noise. Every exchange, every broker, every platform wants one thing from you: volume. The more you trade, the more rebates they collect, the more fees they earn, the more VIP tiers and badges they dangle in front of you to keep you clicking.
Their business does not run on whether you are profitable. It runs on how often you press the button. Your activity is their revenue. Read that again. They are not incentivized for you to win. They are incentivized for you to trade.
And here is the quiet truth underneath it all. The more you trade, the more mistakes you make. It is simple math. Every extra trade is another chance to get it wrong.
And then there is the statistic almost nobody in this space wants to put on a billboard. Depending on the study you read, somewhere around 9 out of 10 day traders lose money over time. 9 out of 10. 90%.
So ask yourself an honest question. Why do you want to go against those odds? Why fight the statistics when the statistics are screaming at you? I am not saying this to discourage you. I am saying it because somebody finally should.
So here is my advice, and it is the opposite of what the industry feeds you. Trade less. Think carefully before you enter. Take a position with a real thesis and hold it.
Stop living on the five-minute chart, refreshing every candle, hunting for the next click. I have been there. I've done exactly that. And I can tell you with confidence that the vast majority of people are going to lose money. That is not me being harsh. That is the data nobody wants to repeat.
So be honest with me. How many trades did you take last week? Drop it in the comments. I read them.
Gianluca Pizzituti, Velotrade's co-founder, has spent more than 25 years trading at London banks and building algorithmic strategies. In this short video he argues that most traders simply trade too much, and that the industry around them rewards volume rather than results. His core argument is arithmetic: "Every extra trade is another chance to get it wrong." His practical advice is to slow down and hold positions with a real thesis, and to "Stop living on the five-minute chart."
How much does overtrading cost?
Overtrading costs the sum of every spread, commission and fee you pay, multiplied by the number of trades you take. That cost is fixed per trade, so it grows in a straight line with activity while your edge does not.
The chart assumes 6 USD of spread and commission per round trip (one entry and one exit) over 21 trading days in a month:
- 1 trade a day: 6 x 21 = 126 USD a month
- 5 trades a day: 6 x 5 x 21 = 630 USD a month
- 10 trades a day: 6 x 10 x 21 = 1,260 USD a month
- 30 trades a day: 6 x 30 x 21 = 3,780 USD a month
On a 10,000 USD account, 3,780 USD is 37.8% of the account per month spent on costs. The 6 USD figure is illustrative; plug in your own platform's spread and commission.
Worked example: cost vs edge per trade
The cleaner way to see the damage is per trade, using R, where 1R is the amount you risk on one trade.
Assume a 10,000 USD account risking 0.5% per trade, so 1R = 50 USD. Costs are 6 USD per round trip.
| Trade type | Edge before costs | Edge in USD | Cost | Net per trade |
|---|---|---|---|---|
| A-setup (planned) | +0.40R | +20 USD | 6 USD | +14 USD |
| Marginal setup | +0.10R | +5 USD | 6 USD | -1 USD |
| Boredom trade | 0R | 0 USD | 6 USD | -6 USD |
Now compare two days. On day one you take three A-setups: 3 x 14 = +42 USD expected. On day two you take the same three A-setups plus seven marginal and boredom trades (say four marginal and three boredom): 42 + (4 x -1) + (3 x -6) = 42 - 4 - 18 = +20 USD expected. You did more than three times the work and halved your expected profit. In practice, tired and frustrated decisions are often worse than zero edge.
Broker disclosures and academic studies consistently find that most retail day traders lose money, and higher activity tends to make that harder to escape, not easier. Barber and Odean (2000) found that the households that traded most earned the lowest net returns.
Payout proof
Fast, real payouts. Traceable on Arbitrum.
- Paid within 24 hours of approval
- Settled on Arbitrum in USDC or USDT
- Look up any transaction on Arbiscan


What are the signs of overtrading?
The clearest sign of overtrading is that your trade count rises while your reasons for each trade get vaguer. These four patterns show up again and again in trading journals.
Boredom trades
A boredom trade is a position opened because nothing is happening and the screen feels like it demands action, so you start finding "almost" setups. If you would not have taken the trade in a busy session, it is a boredom trade.
Drifting to lower timeframes
When the four-hour chart offers nothing, many traders drop to the 15-minute, then the 1-minute chart until something looks tradeable. Lower timeframes produce more signals, more noise and more cost per unit of movement. If your plan is built on the four-hour chart, entries taken from the one-minute chart are a different strategy you have never tested.
More trades after losses
If your trade count goes up on red days, you are trading to repair a feeling, not to follow a plan. This is the bridge between overtrading and revenge trading.
Trading outside your sessions
Every strategy has hours when it works best, for example the London and New York overlap for major forex pairs, or the US cash session for index ETFs like SPY and QQQ. Trades taken at 2am because you could not sleep, or in thin pre-market conditions, are trades outside the conditions you tested.
Why do traders overtrade?
Traders overtrade because three forces push in the same direction: the platform environment, the brain's reward system and fear of missing out.
- Platform incentives. Exchanges, brokers and trading apps generally earn from activity, and notifications, leaderboards and VIP tiers keep you engaged. That environment pulls you towards frequency.
- Dopamine and variable rewards. Research in behavioural science suggests that unpredictable rewards are especially compelling, and trading delivers random wins on random trades. Each click can feel more stimulating than waiting for a planned setup.
- FOMO. A market moving without you creates pressure to join late, covered in our guide to FOMO trading.
Daily income goals make it worse, because they push you to trade until the number is hit. If trading starts to feel compulsive or affects your life outside markets, speaking to a qualified professional is a sensible step.
How do you know if you are overtrading? A journal self-audit
You know you are overtrading when your journal shows results getting worse as trade count rises, or when unplanned trades lose money on average. A trading journal turns a vague feeling into evidence.
Record every trade in R-multiples so results are comparable across position sizes.
The chart shows ten journaled trades: four winners, six losers, a 40% win rate and +3R in total. Now add a setup tag column. If the winners came mostly from planned setups and the losers mostly from unplanned entries, the plan is working and the extra trades are giving part of it back.
Run this audit over at least 30 to 50 trades:
- Tag every trade as A (full plan setup), B (partial setup) or C (no setup, impulse, boredom or revenge).
- Add a trades-per-day column and the day's total result in R.
- Group results by tag. Calculate total R and average R for A, B and C trades separately.
- Group days by trade count, for example 1 to 3 trades, 4 to 6 and 7 or more, and compare average daily R.
- Note the time and timeframe of each entry to spot session drift and timeframe drift.
- Write one rule from the result. If C trades are negative on average, the rule is "no C trades". If days with 7 or more trades are your worst, the rule is a daily cap.
If you only do one thing, count your trades. Gianluca ends his video with a direct question: "How many trades did you take last week?" Most traders who overtrade cannot answer it.
How do you stop overtrading?
You stop overtrading by deciding your limits before the session starts and treating them as fixed rules, not guidelines. These are the four that do the most work.
How many trades a day is too many?
Too many is any number above what your tested strategy produces on average. A swing trader might take two trades a week, a scalper 15 a day by design. Set your cap at your journal's average number of valid A-setups per day; when you hit it, the session is over.
A-setups only
Write down exactly what an A-setup looks like: market, timeframe, trigger, stop-loss placement and target. If a trade does not match every element, skip it. Pre-defining entries with limit orders helps too, because the order sits at your level instead of you chasing price; see market order vs limit order.
Fixed session windows
Choose the hours you trade, for example 13:30 to 16:00 UTC, and close the platform outside them.
Move up a timeframe
If you overtrade the 5-minute chart, try the 15-minute or 1-hour chart: fewer signals, wider targets relative to costs and more time to think. Gianluca's advice to take a position with a real thesis and hold it fits naturally with a higher timeframe.
Other useful limits: a maximum of two losses in a row before a break, a daily loss stop well inside any hard limit, and sizing each trade with the position size calculator so size never becomes a way to chase. Pair these limits with a written plan and the habits in trading discipline.
Overtrading and prop firm evaluations
In a prop firm evaluation, overtrading is one of the fastest ways to burn through the room your account gives you. Velotrade, a multi-asset prop trading firm offering simulated evaluations, uses hard limits that act as an external discipline system:
- Daily loss limit: resets every day at 00:30 UTC and is set from the higher of your balance or equity at that moment (CLASSIC 2-Step 5%, CLASSIC 1-Step 4%, PRO 1-Step 3%).
- Maximum drawdown: static, fixed from account activation (10%, 7% and 3% respectively), explained in static maximum drawdown.
- No time limit: each phase has a minimum trading period but no maximum, so there is no clock forcing you to trade more.
With no clock, there is no reason to force trades, so trade your normal plan at your normal frequency. A string of small boredom losses can consume a 3% or 4% daily limit surprisingly fast once costs are included. Set personal limits tighter than the platform's, so the hard limit is a backstop you never touch. Our guide on why traders fail prop challenges covers the other common mistakes, and you can compare plans on the challenges page.
Can AI help with overtrading?
AI tools can help spot overtrading by analysing a trading journal for patterns such as results by hour, setup tag or trade count. They can also help test whether a higher-timeframe version of your strategy holds up, as covered in backtesting trading strategies and AI trading strategies.
AI does not remove risk or the need for discipline. A model can show you that your seventh trade of the day loses on average, but only you can close the platform. Treat any AI output as one input for human judgement, not a reason to trade more.
Sources
- Barber and Odean, "Trading Is Hazardous to Your Wealth", Journal of Finance (2000): households that trade most earn the lowest net returns.
- FINRA, "Frequent Intraday Trading: Understanding the Basics": risks of frequent intraday trading.
- Investor.gov (SEC), "Types of Orders": how limit orders execute at your price or better.
Frequently Asked Questions
About the author

Gianluca Pizzituti
Chief Executive Officer
Formerly on the derivatives desk at Dresdner Kleinwort in London, then founded and ran a proprietary HFT firm in FX and equity indices out of Singapore.
View author page