New to funded trading?
ExploreA trading journal is a written record of every trade you take: why you entered, how much you risked, how you exited, what the result was, and what you were thinking at the time. It turns a pile of individual wins and losses into data you can review, so you can see which setups actually make money and which habits keep costing you.
A journal works the same way across all the types of trading, from scalping to swing and position trading, because every trading style produces entries, exits, risk and decisions. This guide covers what to track, a free template, R-multiples, expectancy and a weekly review routine.
Quick answer: A trading journal is a log of every trade a trader takes, recording the instrument, setup, entry, stop loss, exit, position size, result in R-multiples (profit or loss divided by the amount risked), and notes on emotions and mistakes. Reviewing the journal weekly shows which setups have a positive expectancy and which behaviours lose money.
Highlights of this article
- A trading journal records the reason, risk, result and mindset behind every trade, not just the profit or loss
- Measure every result in R, where 1R is the amount you risked, so trades of different sizes become comparable
- Expectancy = (win rate × average win) minus (loss rate × average loss); a positive number means the system makes money on average
- Ten example trades with a 40% win rate still net +3R, an expectancy of +0.3R per trade
- Tag every trade by setup and by mistake, then review the tags once a week
- A spreadsheet is enough to start; an app saves time once you trade often
Ready to get funded?
Trade up to $200,000 in firm capital with static drawdown, no consistency rule, and payouts within 24 hours. Pass the challenge and keep up to 90% of your profits.
 2:24
2:24Read the transcript
The trade that made you money might be the one that ruins you. Stay with me on this.
I am Gianluca Pizzituti, CEO of Velotrade. I've been trading for over 25 years, and I want to talk about the most dangerous winning trade.
Picture this. Your strategy is clear. Every rule you follow is screaming the same thing: do not enter. There is no signal. There is no setup. Nothing lines up.
And you enter anyway. Call it a feeling, call it boredom, call it whatever you like. And then it works. The trade runs in your favor and you make money. Feels great, doesn't it?
It shouldn't. Because that win just taught you the worst lesson of your entire career.
Here is what most traders never understand. A profitable trade and a good trade are two completely different things. When you make money on a trade you should never have taken, your brain does not file it under luck. It files it under skill.
You start believing you are smarter than your own system. You start thinking the rules are for everybody else. And that belief is poison.
Because the next time your gut speaks up, you listen. And the time after that. Until one day the market comes to collect. And when it collects, it takes back everything those reckless trades gave you, and then it takes more.
So here is the test I apply to every single trade. If someone sat me down and asked me why I entered, and I could not give a clear answer, something is fundamentally wrong.
And notice I said nothing about whether it won or lost. That part does not matter. If you cannot explain why you entered, it was a bad trade. Full stop.
Because a win you cannot explain is a win you cannot repeat. And trading is nothing but repetition. If you cannot do it again tomorrow for the same reason, you do not have a strategy. You have a coin flip that happened to land your way.
So the next time you break your own rules and get rewarded for it, do not celebrate. Worry. That is the market setting a trap, and you just walked straight into it.
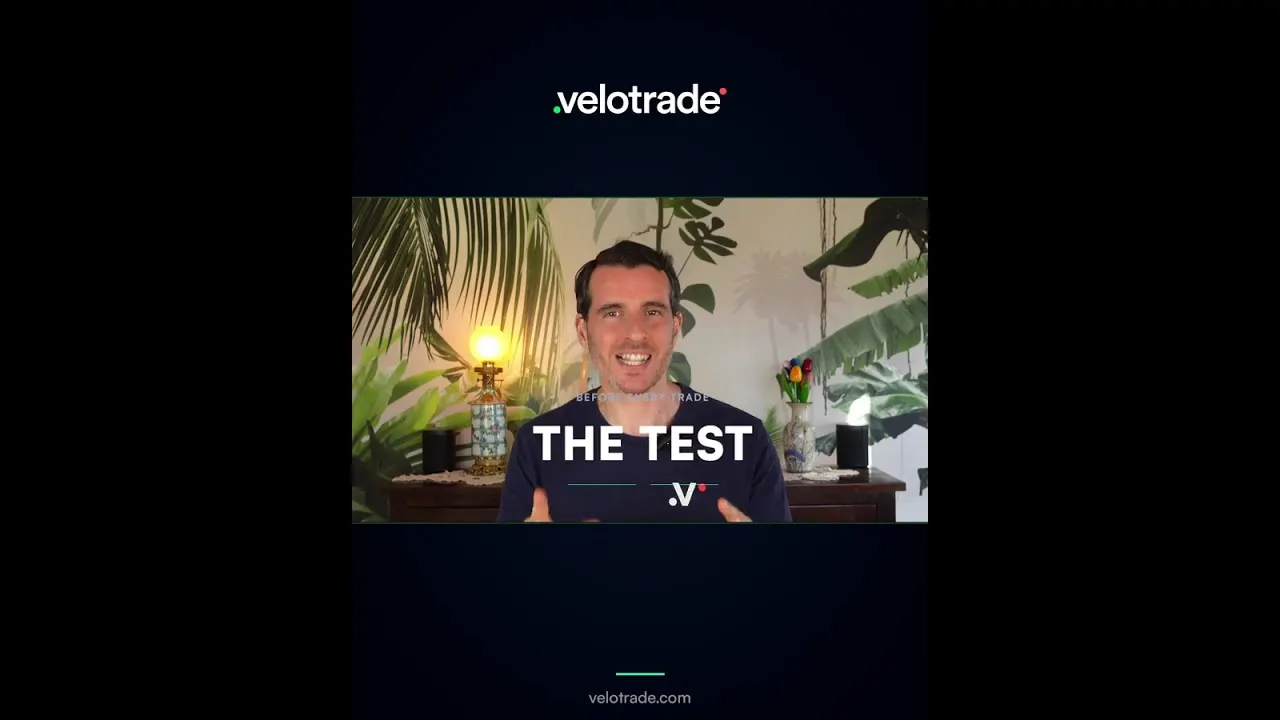
In this short video, Gianluca Pizzituti, Velotrade's co-founder, explains why the most dangerous trade can be a winning one. His point is the reason a journal records the reason for every entry, not just the result: "A profitable trade and a good trade are two completely different things."
What is a trading journal?
A trading journal is a structured record of your trading decisions and their outcomes, with one row per trade. Your platform already keeps a trade history with prices and profit. What it cannot record is why you entered, whether you followed your plan, and how you felt. Those are the fields that explain your results.
Why should you keep a trading journal?
You should keep a trading journal because memory is biased and results are noisy. Traders remember big wins and explain away losses, and a few lucky trades can make a bad habit look profitable for weeks. A journal helps you:
- Find your edge. See which setups, instruments and times of day produce positive results, and which do not.
- Spot repeated mistakes. Moving a stop, adding to a loser, or trading out of boredom shows up as a pattern once it is written down.
- Separate process from outcome. A losing trade that followed the plan is fine. A winning trade that broke the plan is a warning.
- Build discipline. Writing down the reason for a trade makes it harder to take one with no reason.
Gianluca's test from the video is simple: if you cannot explain why you entered, it was a bad trade, whatever the result. As he puts it, "a win you cannot explain is a win you cannot repeat".
What should you track in a trading journal?
You should track enough to rebuild the trade and the decision behind it later, and no more.
| Item | Detail |
|---|---|
| Definition | A log of every trade with its reason, risk, result and notes |
| Core fields | Date, instrument, direction, setup, entry, stop, target, exit, size, risk, result in R |
| Behaviour fields | Followed plan (yes/no), mistake tag, emotion before and after |
| Key formula | R-multiple = profit or loss ÷ amount risked |
| Key metric | Expectancy = (win rate × average win) minus (loss rate × average loss) |
| Review frequency | Short note after each trade, full review once a week |
| Tools | Spreadsheet or journaling app, plus a chart screenshot per trade |
| Main risk | Logging inconsistently or only logging the trades you are proud of |
Trade data fields
- Date, instrument and direction (for example EURUSD, long).
- Setup: the named pattern or rule that triggered the trade, such as a pullback to support and resistance or a breakout from one of the classic chart patterns.
- Entry price and order type (market or limit; see market order vs limit order).
- Stop loss price at entry. If you are unsure where it belongs, start with our guide to where to put a stop loss.
- Target and exit price, with the reason for the exit (target, stop, trailing stop, manual).
- Position size, amount risked and result in dollars and in R.
Behaviour and context fields
Add whether you followed the plan (yes or no), a mistake tag, your emotion before entry and after exit, the market context (trend, news, volatility), a chart screenshot, and one lesson in a single sentence.
Free trading journal template
Copy this table into a spreadsheet. Each row is one trade; the example rows show how to fill it in.
| # | Date | Instrument | Long/Short | Setup | Entry | Stop | Target | Exit | Risk ($) | Result ($) | R | Followed plan? | Mistake tag | Emotion | Lesson |
|---|---|---|---|---|---|---|---|---|---|---|---|---|---|---|---|
| 1 | 2026-10-05 | EURUSD | Long | Pullback to support | 1.1000 | 1.0980 | 1.1040 | 1.1040 | 100 | 200 | 2.0 | Yes | None | Calm | Waited for the limit fill |
| 2 | 2026-10-06 | BTCUSD | Short | Range top rejection | 64,000 | 64,500 | 63,000 | 64,500 | 100 | -100 | -1.0 | Yes | None | Impatient | Valid setup, stop hit |
| 3 |
Add summary cells for total R, win rate and expectancy at the top of the sheet.
Payout proof
Fast, real payouts. Traceable on Arbitrum.
- Paid within 24 hours of approval
- Settled on Arbitrum in USDC or USDT
- Look up any transaction on Arbiscan


What is an R-multiple?
An R-multiple is the result of a trade divided by the amount you risked on it. If you risk 100 USD between entry and stop and make 200 USD, the trade is +2R. If the stop is hit for a 100 USD loss, the trade is -1R. If you exit early for a 50 USD loss, the trade is -0.5R.
Measuring in R makes every trade comparable: a 500 USD profit is +5R on 100 USD of risk but only +0.5R on 1,000 USD. Losses much bigger than -1R show that stops were moved or ignored. A position size calculator helps you keep 1R at the same dollar amount on every trade.
The chart shows ten journaled trades. Four are winners (+2R, +1.5R, +3R and +2R) and six are losers (five at -1R and one at -0.5R, where the trader exited early). The win rate is only 40%, yet the total is +3R because the average winner is more than twice the size of the average loss.
How do you calculate expectancy?
Expectancy is the average amount you can expect to win or lose per trade, measured in R. The formula is:
Expectancy = (win rate × average win) minus (loss rate × average loss)
Here is the worked example using the ten trades from the chart.
- Count wins and losses. 4 winners and 6 losers out of 10 trades, so the win rate is 40% (0.4) and the loss rate is 60% (0.6).
- Average win. (2 + 1.5 + 3 + 2) ÷ 4 = 8.5 ÷ 4 = 2.125R.
- Average loss. (1 + 1 + 1 + 1 + 1 + 0.5) ÷ 6 = 5.5 ÷ 6 = about 0.917R.
- Apply the formula. (0.4 × 2.125) minus (0.6 × 0.917) = 0.85 minus 0.55 = +0.3R per trade.
- Check it. Net result is 8.5R minus 5.5R = +3R over 10 trades, which is +0.3R per trade. The two methods agree.
If 1R is 100 USD, an expectancy of +0.3R means the system made an average of 30 USD per trade over this sample. Ten trades is a tiny sample, so treat it as a starting point, not proof, and record net results so fees and spreads are included.
Win rate vs reward-to-risk
Win rate on its own tells you little. It only matters combined with the reward-to-risk ratio, the size of winners relative to losers.
The chart shows the win rate needed to break even at each reward-to-risk ratio, before fees and spreads: 50% at 1:1, 40% at 1:1.5, 33.3% at 1:2, 25% at 1:3 and 20% at 1:4. The formula is break-even win rate = 1 ÷ (1 + reward-to-risk). The example journal above averages a winner of about 2.1R against a loss of about 0.9R, which is why a 40% win rate is enough. Our guide to the risk-reward ratio covers this in more depth.

How should you review your trading journal each week?
You should review your journal once a week, at a fixed time when markets are quiet, using the same steps every time.
- Complete missing entries and screenshots.
- Calculate the numbers: total R, win rate, average win, average loss and expectancy.
- Sort by setup. Calculate total R for each setup tag and note which are negative.
- Sort by mistake tag. Add up the R lost to mistakes, the cost of your errors in clear units.
- Check plan adherence. Look closely at any rule-breaking winners.
- Compare your best and worst trade screenshots side by side.
- Write one rule for next week. One change only, such as "no trades in the first 15 minutes" or "no new trade after two losses in a day". A monthly review over a larger sample is the right time to drop a setup that keeps showing negative expectancy.
How do you tag setups and mistakes?
You tag trades by giving each one a short, consistent label for the setup and, when relevant, the mistake, so notes become categories you can count.
Setup tags describe why you entered. Keep three to six precisely defined setups, such as "pullback to the 20-period moving average in an uptrend". If a trade fits none, tag it "no setup".
Mistake tags describe what went wrong in execution. A practical starting list:
| Mistake tag | What it means |
|---|---|
| Early entry | Entered before the setup confirmed |
| Chased | Entered after the move had already run |
| Moved stop | Widened the stop loss after entry |
| Early exit | Closed a valid trade before the stop or target out of fear |
| Oversized | Risked more than the planned 1R |
| Revenge | Traded to win back a recent loss |
| Boredom | Took a trade with no setup because nothing was happening |
| News | Held through a scheduled event that was not part of the plan |
Over a few weeks, the totals show which mistakes are expensive. Removing one costly mistake often helps more than adding a new strategy.
Why does psychology belong in a trading journal?
Psychology belongs in a trading journal because emotional state drives many execution mistakes, and you can only manage what you record. A note of one or two words before and after each trade is enough: calm, rushed, frustrated, confident, bored.
You may find that trades taken while frustrated are mostly negative, or that your best trades came from waiting for a limit order rather than chasing. Gianluca often warns against overtrading and staring at a five-minute chart all day; a journal shows exactly how often that happens and what it costs. Sometimes the right entry in the journal is a day with no trades, because not trading when there is no setup is also a decision. For more on the mental side, read our guide to trading psychology.
Spreadsheet vs app: which trading journal should you use?
A spreadsheet is the best place to start because it is free, flexible and makes you think about each field. A journaling app saves time once you trade frequently, because it can import fills automatically.
| Factor | Spreadsheet | Journaling app |
|---|---|---|
| Cost | Free | Often a monthly subscription |
| Setup | Copy the template above | Connect or upload your trade history |
| Data entry | Manual | Mostly automatic for prices and sizes |
| Custom fields and tags | Fully flexible | Depends on the app |
| Statistics | You build the formulas | Built-in reports and charts |
| Best for | Beginners, swing and position traders | Active day traders and scalpers with many trades |
Either way, the behaviour fields still need to be written by you. No import can record why you entered.
Can AI help with a trading journal?
AI can help analyse a trading journal, but it cannot fill in the parts that matter most. With enough rows, an AI assistant can summarise results by setup, group notes into themes, or flag that losses cluster at a certain time of day. That kind of pattern finding is similar to the work done when backtesting trading strategies.
AI does not remove risk and does not know your plan unless you write it down. Its output is only as good as the data you log, and every conclusion still needs human judgement before it changes how you trade. For a broader view, see our guide to AI trading strategies.
How does a trading journal help in a prop firm challenge?
A trading journal helps in a prop firm challenge because it shows how close each day came to the account limits. In a challenge at Velotrade, a multi-asset prop trading firm offering simulated evaluations, the daily loss limit is 5% on CLASSIC 2-Step, 4% on CLASSIC 1-Step and 3% on PRO 1-Step. It resets at 00:30 UTC and is set from the higher of your balance or equity at that time. The maximum drawdown is static, as explained in static maximum drawdown explained.
For a challenge, add a column for daily P&L as a percentage. If three -1R losses in a row would breach the daily limit at your size, your 1R is too large. Many reasons in why traders fail prop challenges, such as oversizing and revenge trading, are the mistake tags above.
Frequently Asked Questions
About the author

Gianluca Pizzituti
Chief Executive Officer
Formerly on the derivatives desk at Dresdner Kleinwort in London, then founded and ran a proprietary HFT firm in FX and equity indices out of Singapore.
View author page