New to funded trading?
ExploreThe main types of trading are day trading, swing trading, scalping, position trading, momentum trading, algorithmic trading and news trading. Each trading style is defined mainly by how long a trade is held, which sets the chart timeframes you use, how many trades you take, how much screen time you need and which costs matter most. No style is "best"; the right one is the style that fits your schedule, your capital and your temperament.
Quick answer: Types of trading are approaches to buying and selling financial instruments that differ mainly by holding period. Scalping holds trades for seconds to minutes, day trading closes everything before the session ends, swing trading holds for days to weeks, and position trading holds for weeks to months. Momentum, algorithmic and news trading describe methods that can run on any of these timeframes.
Highlights of this article
- Trading styles are separated mainly by holding period: seconds (scalping), hours (day trading), days to weeks (swing trading) and weeks to months (position trading)
- Momentum, algorithmic and news trading are methods rather than timeframes, so they can be combined with any holding period
- Shorter styles need more screen time and are more sensitive to costs such as the spread; longer styles need more patience and wider stops
- Choose a style by three filters: the time you can give the market, the capital you can risk, and how you handle stress and waiting
- Fundamental and technical analysis are two ways of deciding what to trade, and most traders use some of both
- Broker disclosures and academic studies consistently find that most retail short-term traders lose money, so risk management matters more than style choice
Ready to get funded?
Trade up to $200,000 in firm capital with static drawdown, no consistency rule, and payouts within 24 hours. Pass the challenge and keep up to 90% of your profits.
What are the main types of trading?
The main types of trading are four holding-period styles (scalping, day trading, swing trading and position trading) and three methods (momentum, algorithmic and news trading) that sit on top of them. A holding-period style answers "how long am I in the trade?". A method answers "what makes me enter?".
A momentum trader can be a day trader who buys the strongest stock of the morning, or a position trader who holds a strong trend for three months. An algorithm can scalp or swing.
Trading styles compared
The table below compares all seven types of trading on the facts that decide whether a style fits your life. Each style links to its full guide where one exists.
| Style | Typical holding time | Typical timeframes | Trades | Time needed | Main costs | Suits |
|---|---|---|---|---|---|---|
| Scalping | Seconds to minutes | Tick, 1-minute, 5-minute | Many per day | Several focused hours daily | Spread and commission on every trade | Fast decision-makers with full-time screen access |
| Day trading | Minutes to hours, closed same day | 5-minute, 15-minute, 1-hour | A few per day | 2 to 6 hours daily | Spread, commission, slippage | People who can trade a fixed session every day |
| Swing trading | Days to a few weeks | 4-hour, daily | A few per week | 30 to 60 minutes daily | Overnight financing, gaps | People with a job who can check charts once or twice a day |
| Position trading | Weeks to months | Daily, weekly | A few per month | A few hours per week | Financing, large adverse swings | Patient traders who think in big trends |
| Momentum trading | Any, usually hours to weeks | Matches the holding style | Varies | Varies | Late entries, sharp reversals | Traders comfortable buying strength |
| Algorithmic trading | Any, set by the code | Any | From a few to thousands | Heavy upfront build and testing | Development time, overfitting risk | Systematic thinkers with coding or testing skills |
| News trading | Seconds to days around an event | 1-minute to 1-hour | A few per scheduled event | Bursts around releases | Wide spreads and slippage at the release | Traders who follow the economic calendar |
What is scalping?
Scalping is a trading style that aims to capture very small price moves, often a few ticks or pips, and holds each trade for seconds to a few minutes. Scalpers take many trades per session and rely on tight risk control, deep liquidity and low trading costs.
Costs dominate scalping. If a scalper targets 5 pips on EURUSD and pays a 1 pip spread, the spread alone consumes 20% of the target (1 divided by 5). That is why scalpers favour the most liquid instruments and sessions, and why understanding the bid-ask spread is essential before you try it. For a full breakdown of setups and routines, read the scalping trading guide.
What is day trading?
Day trading is a style where every position is opened and closed within the same trading day, so the trader carries no overnight risk. Day traders typically use 5-minute to 1-hour charts and take a handful of trades per session.
For US stocks, timing is shaped by the exchange session. The chart below shows US stock sessions in Eastern Time.
The regular session runs from 09:30 to 16:00 ET, with pre-market from 04:00 and after-hours until 20:00. The opening hour and the closing hour are highlighted because that is where many day traders concentrate. Pre-market and after-hours trade with thinner liquidity and wider spreads. Forex follows a different, 24-hour rhythm, covered in forex market hours.
In the United States, the pattern day trader rule set by FINRA applies to margin accounts at US broker-dealers: an account that makes 4 or more day trades within 5 business days must hold at least 25,000 USD in equity. A prop firm evaluation is not a brokerage account, so this rule does not apply to it. The day trading for beginners guide covers strategies, routines and capital in detail.
What is swing trading?
Swing trading is a style that holds positions for several days to a few weeks to capture one "swing" of price, such as a move from support to resistance or a pullback within a trend. Swing traders usually decide on the 4-hour and daily charts.
Swing trading suits people with a full-time job, because a daily chart needs attention only once or twice a day. The trade-offs are overnight and weekend gaps, which can jump past a stop, and the patience to sit through normal fluctuations. The swing trading guide explains entries, stop placement and trade management.
Payout proof
Fast, real payouts. Traceable on Arbitrum.
- Paid within 24 hours of approval
- Settled on Arbitrum in USDC or USDT
- Look up any transaction on Arbiscan


What is position trading?
Position trading is a long-term trading style that holds trades for weeks to months to ride a major trend, usually decided on daily and weekly charts. It sits between swing trading and long-term investing.
Position traders take few trades, use wide stops and size positions small enough to survive large swings. A position trader might risk 1% of a 10,000 USD account (100 USD) with a stop 1,000 points away, which is very different from a scalper's 5-pip stop. Fundamentals and macro themes play a bigger role here. See the position trading guide for more.
What is momentum trading?
Momentum trading is a method that buys instruments that are already rising strongly (or sells those falling strongly) on the idea that strong moves tend to continue for a while. It can be applied intraday, over days, or over months.
Momentum traders look for signals such as new highs, rising volume, price above a rising moving average, or a stock gapping on news. The main risk is buying late: by the time momentum is obvious, the move may be exhausted, and reversals can be sharp. Clear exit rules matter more than the entry. Many momentum signals come from technical indicators, which are worth learning before you rely on them.
What is algorithmic trading?
Algorithmic trading is the use of computer code to define, and often execute, trading rules automatically. The rules can follow any style, from high-frequency scalping to slow trend-following on weekly data.
Its strength is consistency: the code applies the same rules every time, with no hesitation or revenge trading. Its weaknesses are the work required to build and test a system and the risk of overfitting, which means tuning rules so closely to past data that they fail on new data. The algorithmic trading guide explains how systems are built and tested.
What is news trading?
News trading is a method that trades the price reaction to scheduled economic releases or unexpected headlines. Typical events are central bank decisions, inflation data and the US jobs report.
The best-known example is the monthly non-farm payrolls release, explained in what is NFP trading. Around big releases, spreads widen and orders can fill far from the requested price (slippage), so news traders either wait for the first spike to settle or trade with reduced size. News trading suits people who follow the economic calendar and can be at the screen at fixed release times.
How do you choose a trading style?
You choose a trading style by matching it to three things you cannot easily change: the time you can give the market, the capital you can risk, and your temperament. Work through them in order.
How much time can you give the market?
Time is the first filter because it rules styles out immediately. Use this guide:
- Under 30 minutes a day: position trading, or swing trading on the daily chart with orders placed in advance.
- 30 to 90 minutes a day: swing trading.
- A fixed 2 to 4 hour window every day: day trading, built around a liquid session such as the US open.
- Most of the day, fully focused: scalping or active day trading.
If your free hours do not overlap with a liquid session, a short-term style will push you into thin, expensive markets. Pick the longer style instead.
How much capital do you need for each trading style?
Capital matters less for the style than for the risk per trade. A common guideline is to risk 0.5% to 1% of the account on each trade. On a 5,000 USD account, 1% is 50 USD. A position trader whose stop must sit 5% below entry can then hold a position worth only 1,000 USD (50 divided by 0.05), while a day trader with a 0.5% stop can hold 10,000 USD of exposure (50 divided by 0.005), if leverage allows it.
Short styles also pay costs far more often, so small accounts feel spreads and commissions more. US stock day traders on margin accounts also meet the pattern day trader minimum described above. The position size calculator turns account size, risk percentage and stop distance into a position size.
Which style suits your temperament?
Temperament is the filter most beginners skip. Ask yourself honestly:
- Do you need to see results quickly, or can you wait days for a trade to work? Impatient traders struggle with position trading; anxious traders struggle with scalping.
- Can you sleep with an open position? If not, day trading or scalping avoids overnight risk.
- Do you follow rules better than you improvise? Rule-followers often suit systematic or algorithmic approaches.
Gianluca Pizzituti, Velotrade's co-founder, often warns against overtrading and living on the five-minute chart, and reminds traders that not trading is also a decision. That advice applies to every style, but it matters most for beginners drawn to scalping. More on this in trading psychology.
How does reward-to-risk shape your style?
Every style needs a positive edge after costs, and the reward-to-risk ratio sets how often you must win to break even. The chart below shows the break-even win rate at different reward-to-risk ratios.
At 1:1 you need to win 50% of trades just to break even; at 1:2 the figure falls to 33.3%, and at 1:4 to 20%. The formula is 1 divided by (1 + reward-to-risk), so at 1:3 it is 1 divided by 4, or 25%. These figures are before fees and spreads. Scalpers often work near 1:1 and need high accuracy, while swing and position traders usually aim for 1:2 or more and accept lower win rates. The risk-reward ratio guide covers this in depth.
Fundamental vs technical approaches
Fundamental analysis decides what to trade from economic and business data, while technical analysis decides from price and volume on the chart. Both can be used with any trading style, though the mix usually shifts with holding period.
| Approach | What it studies | Most useful for | Example |
|---|---|---|---|
| Fundamental | Earnings, valuation, interest rates, economic data, flows | Position and swing trading, news trading | Buying a stock after strong earnings guidance |
| Technical | Price, volume, trends, levels, patterns, indicators | Scalping, day and swing trading, timing entries | Buying a pullback to support in an uptrend |
| Combined | Fundamentals for direction, charts for timing | Most styles | A bullish rate view, entered on a daily-chart breakout |
In the video below, Vittorio De Angelis, Velotrade's co-founder, explains why trading on fundamentals alone is not enough in modern markets, where flows and narratives can move prices far from fair value.
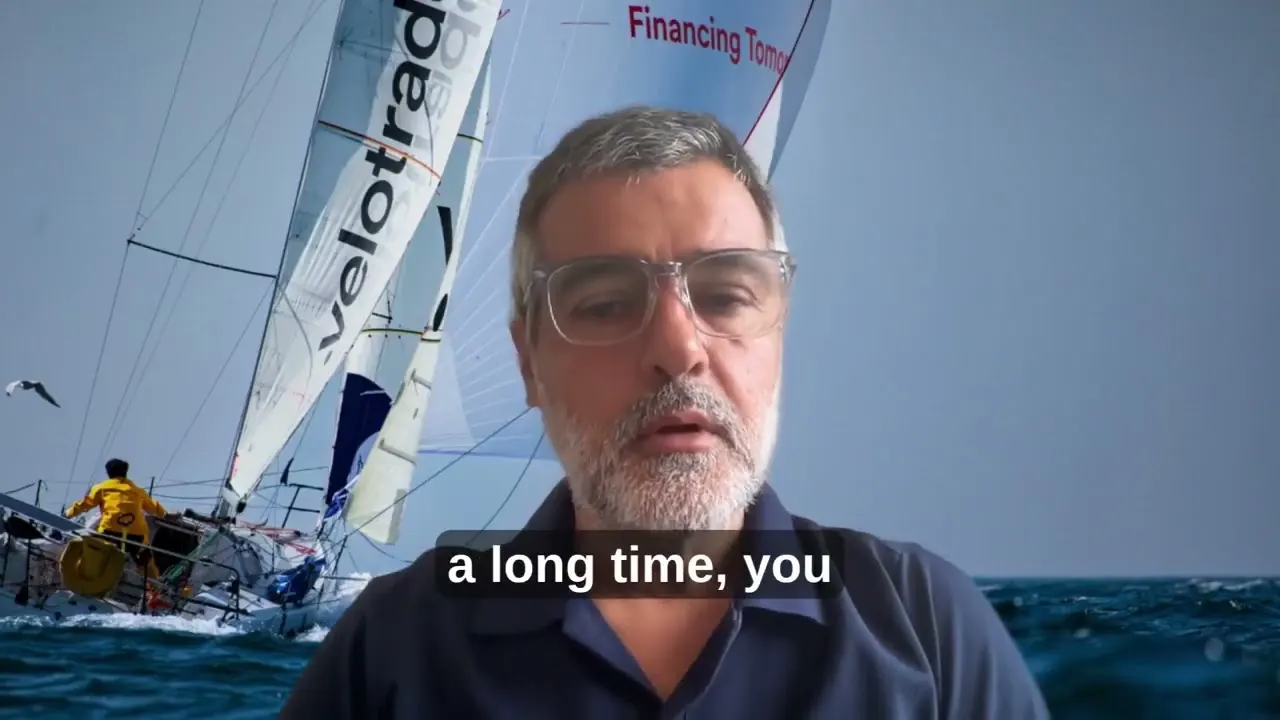 7:20
7:20Read the transcript
Today, a short rant, but an important one, I think. No technical stuff, just a few considerations.
Back in the old days, and I like referring to those, fundamentals were driving trading. I remember the prop desk at Dresdner Bank, sitting next to my desk. They were looking at sectors, and at the themes that were affecting those sectors.
They would then drill in and find catalysts that would explain why a sector should be affected, positively or negatively. Then they would go further in depth and start looking at single names, trying to understand which names had lagged or which had moved too much, whether the general catalyst applied to those names, and whether there were specific events that would trigger interest in them.
It was a very diligent study: very accurate, very tedious, very long. But eventually, once they found the targets, the undervalued company or the overvalued company, they would put on very, very large positions. Their performance was impressive, their P&Ls were staggering. They were very smart and very successful.
The idea underpinning their trading was that ultimately fundamentals do matter, and prices do converge to some sort of fair value.
Now let's fast forward, because the events I'm talking about were at the beginning of the 2000s. One event that was very notable in the financial markets was the rally in GameStop. That was a massive move, and it was completely disconnected from fundamentals.
I remember listening to a very interesting podcast that I still follow diligently, the Prof G podcast. They invited Aswath Damodaran, who is a professor at NYU and is famous for writing books on valuation, fundamental valuation, that have been used in most universities and master's programmes.
I found it rather interesting because the host, Scott Galloway, was asking Damodaran: how do you explain GameStop? You're a fundamentals guy, and you see something so disconnected from fundamentals. How do you justify it?
Damodaran came up with a very interesting answer. He said there are three factors that can explain something like this happening.
One is a total lack of faith in the experts. Once upon a time, experts were regarded as people to follow and listen to. Nowadays, especially the younger cohorts feel that experts don't know what they're talking about.
A second effect, which is tied to technology, is network effects: the Reddit crowd, the possibility of exchanging information, real, fake or not necessarily reliable, very fast.
And third, which is maybe the most worrying part, is a society that is now extremely divided ideologically. I'm referring specifically to the US, where either you're a Democrat or you're a Republican, and your political views affect your trading. Movements in the markets are more and more affected by political decisions, speeches and statements, rather than by fundamental analysis.
Now let's move to another asset class, which is crypto. There are some names in the crypto world that have a massive use. Bitcoin can be seen as a store of value. ETH is powering the new generation of smart contracts. Solana, the same but faster. HYPE, the token of a decentralized exchange, is tied to a business generating real fees.
So these are somewhat fundamentally driven coins. But then you have a whole load of coins, and the most notable is DOGE, which is a meme coin, and nobody's even hiding that. It's an explicitly meme asset, which means it moves on the whims of emotion.
And when you see an asset with no obvious fundamental value being given multi-billion dollar valuations for a long time, you realize that fundamental trading is only part of the story.
All of this to say that, looking forward, I think trading only on fundamentals can be dangerous, because, as Keynes famously put it, markets can remain irrational longer than you can remain solvent.
Valuation is something to bear in mind. I still think it's an important component of a trading decision, but it's not the only one. We have to look at the network effects. We have to see what retail is doing. And this, by the way, applies to all asset classes. Look at the move we saw in gold, which can hardly be anchored to a fundamental explanation.
So my recommendation is: do your work, do your fundamental work, but look outside the box to try to understand what the flows are and what the narratives are.
And this might sound like a contradiction for a value trader, but do look at charts, because charts have the ability to condense information about participants' behavior. Some of the moves you detect in charts might give you insight into the variables we discussed earlier.
I remember this from when I was at university, many, many years ago. A professor gave a lecture on technical analysis, and the whole point of technical analysis, from his perspective back in those days, was that it allows you to find out when the insiders are moving in an asset and when retail is following.
I hope these few words will be helpful in thinking about financial markets in a different way, a modern way, maybe not a better way. But I think that for the foreseeable future, these inefficiencies, these drivers of price that cannot be associated with fundamentals, will remain and might even become prevalent. Thank you.
He still advises traders to "do your fundamental work", and adds that "charts have the ability to condense information about participants' behavior." In practice that means using fundamentals to understand why something might move and charts to see whether the market agrees. Learning to read stock charts and the fundamental vs technical analysis guide are good next steps.
Essential tools for every type of trading
Whatever style you choose, the same core skills decide whether you survive long enough to improve:
- Stop loss on every trade. Decide where you are wrong before you enter, and size the position so that hitting the stop costs a fixed, small share of the account.
- A trading journal. Record entry, exit, reason, result in R (multiples of the amount risked) and emotions. After 30 to 50 trades the journal shows which setups and times of day actually work for you.
- Cost awareness. Know your spread and commission. The bid-ask spread guide shows how quickly they add up for short-term styles.
- Practice first. Paper trading lets you test a style with no money at risk, though it does not reproduce the emotions of real losses.
Options are another way to express a view in any style; call vs put explains the basics (Velotrade does not offer options).
Can AI help you choose or trade a style?
AI can help with parts of the work: screening many instruments for setups that match your style, summarising patterns in your journal, or speeding up the testing of rules. The AI trading strategies guide explains where it fits, and backtesting trading strategies explains how to test any rule on historical data before risking money.
AI does not remove market risk, and a model that looks good on past data can fail on new data. Choosing a style, sizing positions and deciding when not to trade still require human judgement.
How trading styles work in a prop firm evaluation
All seven types of trading can be used in a prop firm evaluation, as long as the trader respects the risk rules. At Velotrade, a multi-asset prop trading firm offering simulated evaluations in crypto, forex, stocks, index ETFs and commodities, the main rules that interact with style are:
- Daily loss limit: 5% on CLASSIC 2-Step, 4% on CLASSIC 1-Step and 3% on PRO 1-Step. It resets at 00:30 UTC and is set from the higher of balance or equity at that time. Scalpers and day traders need to track it closely because many trades can add up quickly.
- Static maximum drawdown: the floor does not trail your profits, which gives swing and position traders room to hold through normal swings. See static maximum drawdown explained.
- No time limit: each phase has a minimum trading period but no maximum, so patient styles are not forced to rush.
- News trading, EAs, bots and API trading are allowed, so news and algorithmic approaches are permitted.
- No forced weekend closures, except for single stocks, which carry earnings, dividend and holding restrictions.
Style-specific guides compare firms in more detail: best prop firm for day trading, best prop firm for swing traders and best prop firm for scalpers. Accounts are simulated and this article is educational, not investment advice.
Common mistakes when picking a trading style
The most common mistake is choosing a style for its excitement rather than its fit. Others include:
- Switching styles after every losing week. A style needs a sample of trades before it can be judged; constant switching means you never learn any of them.
- Mixing timeframes inside one trade. Entering a day trade and turning it into a "swing" when it goes against you replaces a plan with hope.
- Ignoring costs on short timeframes. A strategy that is profitable before costs can lose money after spreads and commissions.
- Risking too much per trade. Large risk per trade turns a normal losing streak into an account-ending drawdown, in any style.
- Confusing a profitable trade with a good trade. A trade that broke your rules and made money is still a bad trade, because it reinforces the wrong habit.
Becoming consistent in any style takes time, and many people never get there. The how to become a trader guide sets realistic expectations.
Frequently Asked Questions
About the author

Vittorio De Angelis
Executive Chairman
Former equity-derivatives trader at JP Morgan, Dresdner Kleinwort and Bank of America in London. Later Head of Brokerage at a global broker in Hong Kong.
View author page