Fundamental analysis asks what an asset is worth. Technical analysis asks what the market is doing with it right now. The first studies earnings, cash flows, economic data and supply and demand; the second studies price, volume and the patterns traders leave behind on a chart. For decades the debate was framed as a choice: you were either a value person or a chart person.
Vittorio De Angelis, Velotrade's co-founder, spent more than 30 years in capital markets, including equity derivatives at JP Morgan, Dresdner Kleinwort and Bank of America. His view is that the old either/or framing no longer works. Fundamentals still matter, charts still matter, and a third driver (flows, sentiment, narratives and network effects) now moves prices often enough that ignoring it is a risk in itself. This guide explains each approach, compares them side by side, and shows how to combine them across stocks, crypto and gold.
Highlights of this article
- Fundamental analysis estimates fair value from earnings, cash flows, macro data and supply and demand; it works best over months and years
- Technical analysis reads price, volume and chart structure; it is most useful for timing entries, exits and risk over hours to weeks
- Fundamentals cannot explain episodes like GameStop in 2021 or meme coins, and charts only partly capture them; in both, flows, sentiment and network effects overwhelmed valuation
- Vittorio's practical recipe: do the fundamental work, look for the flows and narratives, and use charts as a condensed record of participant behaviour
- Combining the two is less about choosing a camp and more about using each for the question it answers best
Ready to get funded?
Trade up to $200,000 in firm capital with static drawdown, no consistency rule, and payouts within 24 hours. Pass the challenge and keep up to 90% of your profits.
 7:20
7:20Read the transcript
Today, a short rant, but an important one, I think. No technical stuff, just a few considerations.
Back in the old days, and I like referring to those, fundamentals were driving trading. I remember the prop desk at Dresdner Bank, sitting next to my desk. They were looking at sectors, and at the themes that were affecting those sectors.
They would then drill in and find catalysts that would explain why a sector should be affected, positively or negatively. Then they would go further in depth and start looking at single names, trying to understand which names had lagged or which had moved too much, whether the general catalyst applied to those names, and whether there were specific events that would trigger interest in them.
It was a very diligent study: very accurate, very tedious, very long. But eventually, once they found the targets, the undervalued company or the overvalued company, they would put on very, very large positions. Their performance was impressive, their P&Ls were staggering. They were very smart and very successful.
The idea underpinning their trading was that ultimately fundamentals do matter, and prices do converge to some sort of fair value.
Now let's fast forward, because the events I'm talking about were at the beginning of the 2000s. One event that was very notable in the financial markets was the rally in GameStop. That was a massive move, and it was completely disconnected from fundamentals.
I remember listening to a very interesting podcast that I still follow diligently, the Prof G podcast. They invited Aswath Damodaran, who is a professor at NYU and is famous for writing books on valuation, fundamental valuation, that have been used in most universities and master's programmes.
I found it rather interesting because the host, Scott Galloway, was asking Damodaran: how do you explain GameStop? You're a fundamentals guy, and you see something so disconnected from fundamentals. How do you justify it?
Damodaran came up with a very interesting answer. He said there are three factors that can explain something like this happening.
One is a total lack of faith in the experts. Once upon a time, experts were regarded as people to follow and listen to. Nowadays, especially the younger cohorts feel that experts don't know what they're talking about.
A second effect, which is tied to technology, is network effects: the Reddit crowd, the possibility of exchanging information, real, fake or not necessarily reliable, very fast.
And third, which is maybe the most worrying part, is a society that is now extremely divided ideologically. I'm referring specifically to the US, where either you're a Democrat or you're a Republican, and your political views affect your trading. Movements in the markets are more and more affected by political decisions, speeches and statements, rather than by fundamental analysis.
Now let's move to another asset class, which is crypto. There are some names in the crypto world that have a massive use. Bitcoin can be seen as a store of value. ETH is powering the new generation of smart contracts. Solana, the same but faster. HYPE, the token of a decentralized exchange, is tied to a business generating real fees.
So these are somewhat fundamentally driven coins. But then you have a whole load of coins, and the most notable is DOGE, which is a meme coin, and nobody's even hiding that. It's an explicitly meme asset, which means it moves on the whims of emotion.
And when you see an asset with no obvious fundamental value being given multi-billion dollar valuations for a long time, you realize that fundamental trading is only part of the story.
All of this to say that, looking forward, I think trading only on fundamentals can be dangerous, because, as Keynes famously put it, markets can remain irrational longer than you can remain solvent.
Valuation is something to bear in mind. I still think it's an important component of a trading decision, but it's not the only one. We have to look at the network effects. We have to see what retail is doing. And this, by the way, applies to all asset classes. Look at the move we saw in gold, which can hardly be anchored to a fundamental explanation.
So my recommendation is: do your work, do your fundamental work, but look outside the box to try to understand what the flows are and what the narratives are.
And this might sound like a contradiction for a value trader, but do look at charts, because charts have the ability to condense information about participants' behavior. Some of the moves you detect in charts might give you insight into the variables we discussed earlier.
I remember this from when I was at university, many, many years ago. A professor gave a lecture on technical analysis, and the whole point of technical analysis, from his perspective back in those days, was that it allows you to find out when the insiders are moving in an asset and when retail is following.
I hope these few words will be helpful in thinking about financial markets in a different way, a modern way, maybe not a better way. But I think that for the foreseeable future, these inefficiencies, these drivers of price that cannot be associated with fundamentals, will remain and might even become prevalent. Thank you.
What is fundamental analysis?
Fundamental analysis is the attempt to estimate an asset's intrinsic or fair value from the economic forces behind it, then compare that value with the market price. If the price is well below fair value, the asset looks cheap; well above, it looks expensive. The underlying belief is that prices eventually converge toward that value.
What "the fundamentals" are depends on the asset:
- Stocks: revenue, earnings, margins, free cash flow, balance sheet strength, management quality, competitive position, and valuation multiples such as price to earnings or enterprise value to EBITDA. Discounted cash flow models sit at the heavy end of this work.
- Currencies and indices: interest rates, inflation, growth, employment and central bank policy. A release like US non-farm payrolls can reprice a whole asset class in seconds (see our guide to NFP trading).
- Commodities: production, inventories, demand cycles, weather, geopolitics and, for gold, real interest rates and central bank buying.
- Crypto: a newer and messier field. Analysts look at network usage, fees generated, token supply schedules, developer activity and the role a token plays in its ecosystem.
How a bank prop desk did it
Vittorio remembers the proprietary trading desk at Dresdner, which sat next to his own in the early 2000s. Their process was textbook fundamental work. They started with sectors and the themes affecting them, looked for catalysts that would push a sector up or down, then drilled down to single names: which stocks had lagged, which had run too far, and whether a company had its own events coming that would draw attention.
"It was a very diligent study, very accurate, very tedious, very long," he says. Once they found an undervalued or overvalued target, they put on very large positions, and their results were impressive. The idea underpinning all of it, in his words, was that "ultimately fundamentals do matter and prices do converge to some sort of fair value."
That is the strength of fundamental analysis in one story: deep, slow work that produces high-conviction views capable of supporting serious size.
What is technical analysis?
Technical analysis ignores, or at least sets aside, what an asset should be worth and studies how its price actually behaves. The core assumptions are that price reflects available information, that prices tend to move in trends, and that crowd behaviour leaves recurring footprints.
Common tools include:
- Trend tools: moving averages, trendlines, higher highs and higher lows
- Support and resistance: price zones where buying or selling has repeatedly appeared
- Momentum and oscillators: RSI, MACD, stochastics
- Volume and market structure: volume spikes, breakouts on heavy volume, volume profile
- Chart patterns: ranges, flags, double tops and bottoms
Technicians usually work on shorter horizons than fundamental analysts, from intraday charts to weekly ones, and they use the chart as much for risk management as for prediction: a level that invalidates the idea is a natural place for a stop.
Charts as a record of behaviour
Vittorio, who describes himself as coming from the fundamental side, still tells traders to look at charts, "because charts have the ability to condense information about participants' behavior." He recalls a university lecture on technical analysis many years ago in which his professor argued that the real point of the discipline was to spot when insiders start moving in an asset and when retail follows.
That framing is useful. A chart is not magic; it is a compressed history of who bought, who sold, and how urgently. Read that way, it complements fundamental work rather than competing with it. For a deeper look at reading the urgency behind moves, see our sibling guide on order flow trading.
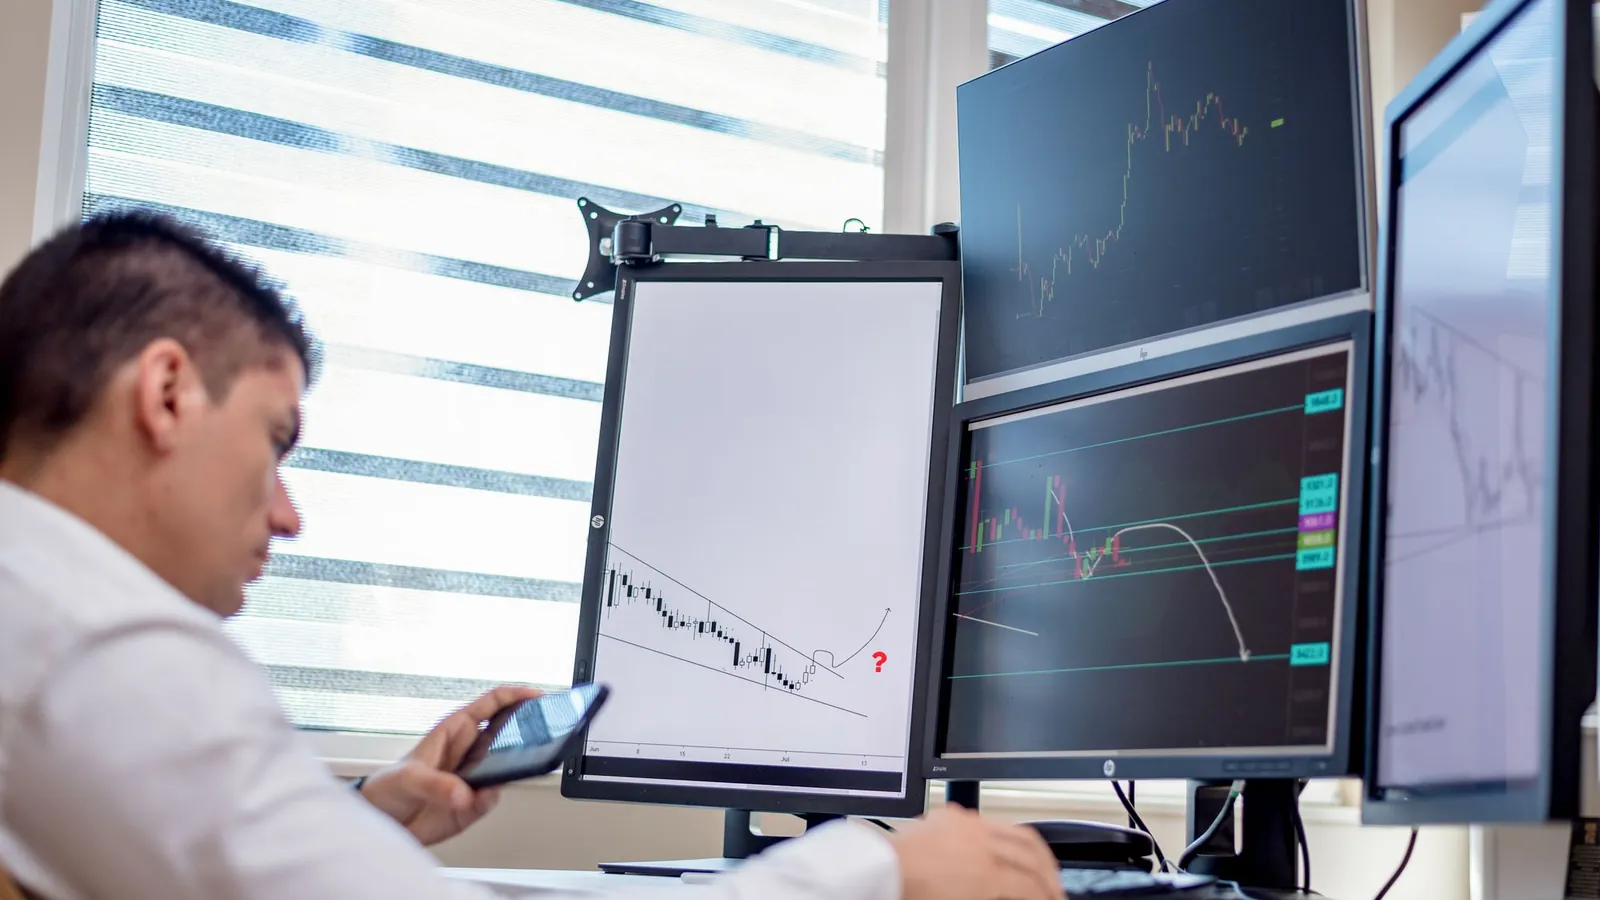
Fundamental vs technical analysis: side by side
| Fundamental analysis | Technical analysis | |
|---|---|---|
| Core question | What is this asset worth? | What is price doing, and when should I act? |
| Main inputs | Financial statements, valuation multiples, macro data, supply and demand | Price, volume, chart patterns, indicators |
| Typical timeframe | Months to years | Minutes to weeks |
| Typical users | Long-term investors, value funds, sector analysts, macro traders | Day traders, swing traders, systematic and trend-following strategies |
| Main strength | Explains why; supports high conviction and size | Precise timing, clear invalidation levels, works on any liquid market |
| Main weakness | Slow, and the market can ignore fair value for a long time | Can describe without explaining; patterns fail and get crowded |
| Best at | Choosing what to trade and in which direction | Choosing when to enter, where to exit, how much to risk |
| Struggles with | Meme assets, sentiment-driven rallies | Sudden news shocks and regime changes |
Strengths and weaknesses in plain terms
Fundamental analysis tells you why something should move, which is what gives a trader the confidence to hold through noise. Its weakness is timing. An undervalued stock can stay undervalued for years, and an overvalued one can keep rising. The line most traders know, usually attributed to John Maynard Keynes, is that the market can remain irrational longer than you can remain solvent.
Technical analysis is good at the when and the where: where the idea is wrong, where to take profit, whether momentum is with you. Its weakness is that it can describe a move without explaining it, and popular patterns can become self-defeating once everyone trades them.
Within technical analysis, price-action frameworks such as ICT trading and smart money concepts focus on where liquidity sits rather than on indicators.
The third driver: flows, sentiment, narratives and network effects
The debate used to stop at those two camps. Vittorio's point is that recent markets have added a third force that neither fully captures.
GameStop and Damodaran's three explanations
The rally in GameStop in early 2021, driven largely by retail traders coordinating on Reddit, was, as Vittorio puts it, "completely disconnected from fundamentals." He recalls an episode of Scott Galloway's Prof G podcast with Aswath Damodaran, the NYU professor whose valuation textbooks are used across universities and finance masters programmes. Galloway asked, in effect, how a fundamentals person explains something like GameStop.
As Vittorio remembers it, Damodaran offered three explanations:
- A loss of faith in experts. Experts were once people to follow; many younger investors now believe they do not know what they are talking about.
- Network effects. Technology lets a crowd share information (real, fake, or unreliable) very fast and act on it together.
- Political and ideological division. In a deeply divided society, political views can shape trading decisions, and markets react more to political statements and speeches than to valuation work.
None of these appear in a discounted cash flow model or a moving average, yet each can move price for a long time.
Crypto: fundamental-ish coins and pure meme coins
Crypto makes the split especially visible. Vittorio describes some large tokens as having arguably fundamental-style narratives: Bitcoin as a possible store of value, Ethereum as infrastructure for smart contracts, Solana as a faster smart-contract network, and Hyperliquid's HYPE token tied to a decentralised exchange that generates real fees. These are his illustrations of how analysts reason about crypto value, not recommendations to buy any of them.
At the other end sit meme coins, with Dogecoin the most famous. "Nobody's even hiding that," Vittorio says. "It's an explicitly meme asset." When a token with no claim to cash flows holds a multi-billion dollar valuation for years, he concludes, "you realize that fundamental trading is only part of the story." You can explore how crypto behaves across the spectrum on our crypto markets page.
Gold
Gold is the third example. Vittorio's view is that gold's move "can hardly be anchored to a fundamental explanation." Its run to repeated record highs in 2024 and 2025 shows why: analysts cited central bank buying, geopolitical risk, and expectations for interest rates, but the size of the move also reflected flows and narrative: buyers buying because others were buying. Gold and other metals are covered on our commodities page.

How to combine fundamental and technical analysis in practice
Vittorio's recommendation is simple: "Do your work, do your fundamental work, but look outside the box to try to understand what the flows are and what the narratives are." Then look at charts, because they show how participants are actually behaving. In practice that becomes a layered process.
Step 1: form a view with fundamentals
Decide what you believe and why. Is the company growing faster than its valuation implies? Is the central bank likely to cut while the market prices hikes? Does a commodity have a supply problem? Write the thesis down in one or two sentences. If you cannot, you do not have one.
Step 2: check the flows and the narrative
Ask who else is in the trade and what story they are telling. Is retail piling in? Is the asset trending on social media? Are there political headlines driving it? A strong fundamental case against a crowded, narrative-driven move is not a reason to fight it today; it may be a reason to wait.
Step 3: use the chart for timing and risk
Let price confirm the idea. A fundamentally cheap stock that is still making lower lows may need more time. Use support, resistance and recent swing points to define where the thesis is wrong, then size the position so that a stop at that level costs a small, fixed share of your account. Our risk reward ratio guide walks through that maths.
Worked examples across markets
| Market | Fundamental question | Third-driver check | Technical use |
|---|---|---|---|
| A large-cap stock after earnings | Did guidance change the long-term cash flow picture? | Is the stock a retail or social media favourite? | Wait for a hold above the post-earnings gap before entering; stop below it |
| An index ETF such as SPY or QQQ | Where are rates, earnings growth and the economy heading? | Are flows driven by a policy headline or political news? | Use the trend and key levels around major data releases |
| A large crypto token | Is network usage or fee generation growing? | Is the move driven by a narrative cycle or a meme wave? | Respect momentum, keep size small given volatility |
| Gold | What are real rates and central bank demand doing? | Is buying momentum and fear driving the move? | Trail stops under higher lows rather than calling a top on valuation |
For stocks, our stocks page lists what you can trade; for broad market exposure through ETFs, see how to trade indices.
Which is better: fundamental or technical analysis?
Neither, on its own. Fundamental analysis is the better tool for deciding what to own and in which direction over longer horizons. Technical analysis is the better tool for deciding when to act and how to control risk. The third driver is the reminder that both can be overwhelmed for long stretches by crowds, narratives and politics.
Vittorio's closing view is that these non-fundamental drivers of price are likely to remain, and may even become more dominant. That is not a reason to abandon valuation; he still sees it as an important part of any trading decision. It is a reason to hold your fundamental view with humility, to watch what the crowd is doing, and to let the chart tell you when the market agrees with you.
Practising the combined approach
Whatever mix you choose, the real test is whether you can follow it with fixed risk limits. Velotrade's simulated evaluations use a static maximum drawdown, so the loss limit does not move as your account grows, which rewards traders who size positions to a clear invalidation level rather than to conviction alone. This article is educational and is not investment advice.
Ready to trade with $200,000 capital?
Explore challengesFrequently Asked Questions
About the author

Vittorio De Angelis
Executive Chairman
Former equity-derivatives trader at JP Morgan, Dresdner Kleinwort and Bank of America in London. Later Head of Brokerage at a global broker in Hong Kong.
View author page