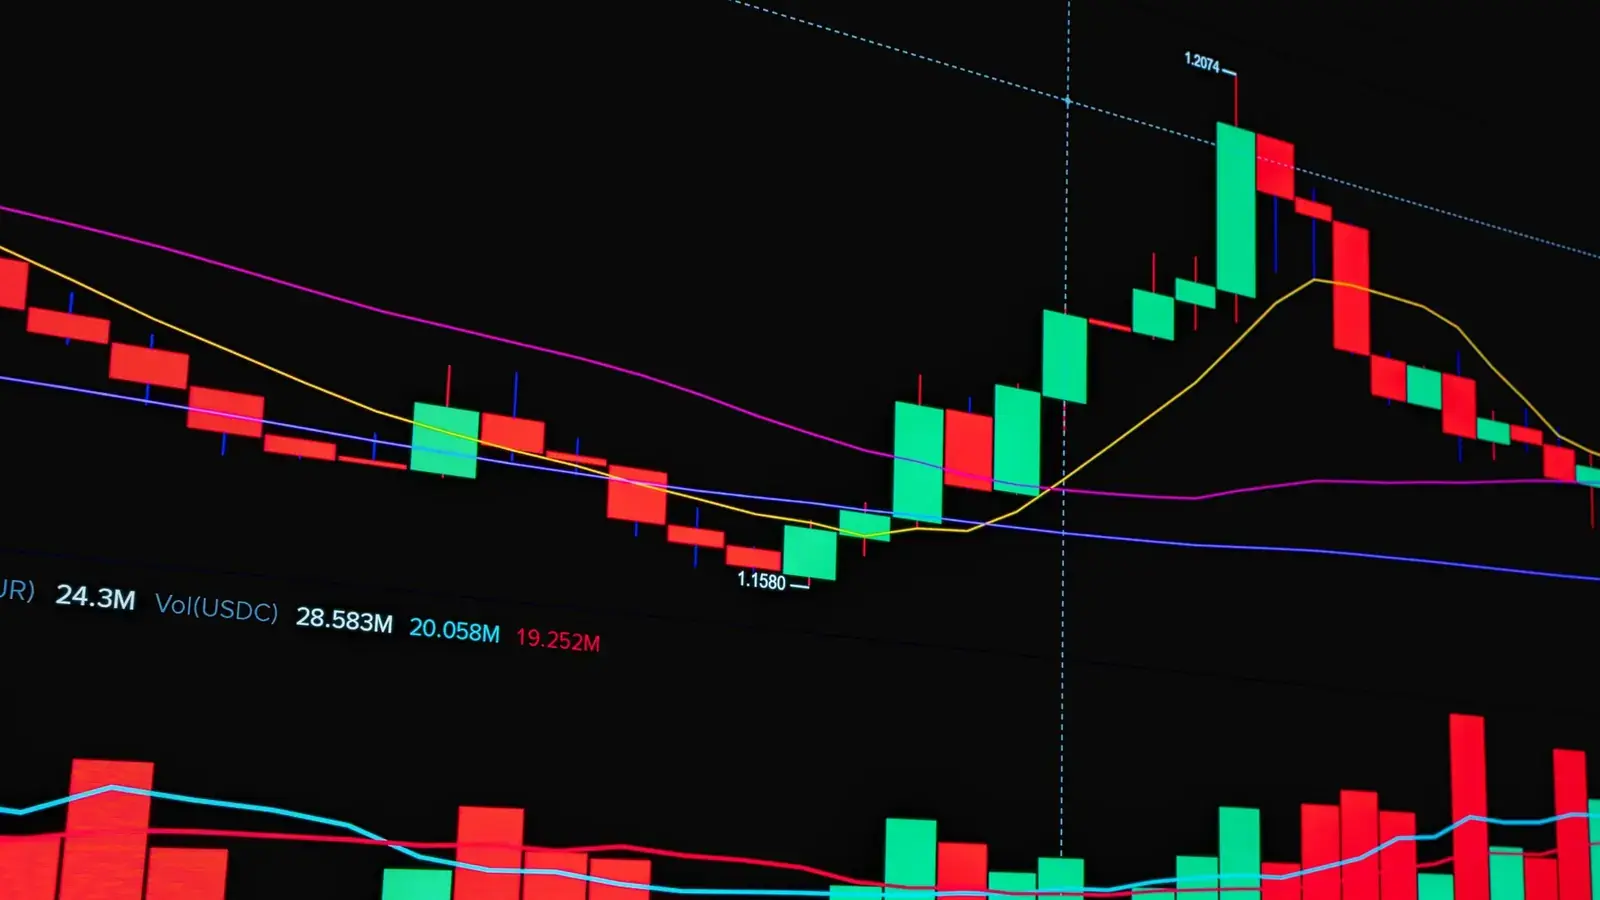
ICT trading is a discretionary price action method, popularised by Michael J. Huddleston ("The Inner Circle Trader"), that reads charts in terms of liquidity: where stop orders are resting, how price runs them, and where it is likely to go next. A typical ICT setup waits for price to sweep a pool of liquidity, shift structure with a strong move, and then offers an entry on a pullback into a fair value gap or order block, aimed at the liquidity on the other side. Timing matters too: ICT traders focus on specific session windows called kill zones.
This guide is the hub of our ICT series: the core concepts, the full setup step by step, kill zones, risk management, the honest limits of the approach, and how to apply it in a prop challenge.
Highlights of this article
- ICT trading is a liquidity based way of reading price action, taught by Michael J. Huddleston and widely shared in online trading communities
- The core sequence is: liquidity sweep, break of structure, entry at a fair value gap or order block, target the opposing liquidity
- Kill zones are the session windows (London open, New York open) where ICT traders expect the cleanest moves
- The silver bullet and optimal trade entry (OTE) are specific timing and retracement models built on the same ideas
- ICT is subjective and chart examples are always clearer in hindsight, so backtesting and strict risk per trade matter more than any single concept
- In a prop challenge, size every ICT trade against the daily loss limit and the static maximum drawdown, not against the setup's confidence
Ready to get funded?
Trade up to $200,000 in firm capital with static drawdown, no consistency rule, and payouts within 24 hours. Pass the challenge and keep up to 90% of your profits.
What ICT trading is and where it comes from
ICT stands for Inner Circle Trader, the online name of Michael J. Huddleston. Over many years of free videos and paid mentorships he built a vocabulary for describing price action: liquidity pools, fair value gaps, order blocks, premium and discount, kill zones, and named models such as the silver bullet. That vocabulary spread across YouTube, X and Discord, and today "ICT concepts" and "ICT strategy" are used loosely for any setup built from those ideas.
The central claim of the method is simple. Markets do not move randomly from one price to the next; they move from one area of resting orders to another. Stop-loss orders cluster above obvious highs and below obvious lows. Large participants need that liquidity to fill size, so price is often drawn to those pools, runs them, and then reverses or continues once the orders are absorbed.
To be precise: there is no institutional desk drawing "order blocks" on a chart. What is real is order flow: large orders need a counterparty, and clusters of stops and pending orders provide one. ICT is a retail framework that labels the footprints this process tends to leave on a chart. If you want the institutional reality behind the idea of "smart money", our co-founder Vittorio's article on order flow trading describes how orders actually moved on a bank desk.
ICT also overlaps heavily with Smart Money Concepts (SMC), a simplified offshoot that kept most of the terms and dropped some of the time based models. We cover the differences in smart money concepts.
The core ICT concepts at a glance
Each concept has its own detailed guide; read this table as a map of the series.
| Concept | What it means in ICT | Role in the setup | Full guide |
|---|---|---|---|
| Liquidity (buy-side and sell-side) | Clusters of stop and pending orders above highs (buy-side) and below lows (sell-side) | The fuel: price raids one pool, then targets the other | Liquidity sweep |
| Market structure, BOS and CHoCH | Swing highs and lows; a break of structure confirms trend, a change of character signals a possible reversal | Confirms that the sweep produced a real shift | Break of structure |
| Fair value gap (FVG) | A three-candle imbalance where candle 1 and candle 3 do not overlap | Preferred entry zone after displacement | Fair value gap |
| Order block | The last opposing candle before an impulsive move that breaks structure | Alternative or combined entry zone | Order block |
| Premium and discount | The upper and lower halves of a dealing range, split at the 50% equilibrium | Filters where you buy (discount) and sell (premium) | Smart money concepts |
| Kill zones | Specific session windows in New York time | Tells you when to look for the setup | Covered below |
The ICT setup, step by step
Most ICT models are variations of one sequence. The chart below shows it in four steps on an illustrative bullish example: an overnight range forms, price sweeps the sell-side liquidity below it, a displacement candle breaks structure to the upside and leaves a fair value gap, and price returns to the gap before running toward the buy-side liquidity above the range.
Step 1: Mark the liquidity and the bias
Start on a higher timeframe (daily or 4-hour) and decide which side of the market you favour. Then mark the obvious liquidity on your execution timeframe: the overnight or Asian session high and low, previous day high and low, and any equal highs or equal lows. Equal lows are especially attractive to ICT traders because so many stops sit in the same place.
Step 2: Wait for the sweep
A sweep is a move through the level that fails to hold. Price trades below the lows, triggers the sell stops, and then closes back inside the range. The close back inside is the important part: a candle that closes well below the level and holds there is a breakdown, not a sweep. The liquidity sweep guide shows the difference side by side.
Step 3: Confirm displacement and a break of structure
After the sweep, you want a strong, fast move in the opposite direction, often called displacement, that breaks the most recent swing high on a candle close. That break of structure (or change of character, if it reverses the prior trend) is your evidence that the sweep was a turning point rather than noise.
Step 4: Enter on the pullback into the FVG or order block
Displacement usually leaves a fair value gap, and the move often starts from an identifiable order block. Rather than chasing the impulse, ICT traders place a limit order in the gap or block and wait for price to come back. If you want to understand why a resting limit order suits this kind of entry, our guide to market order vs limit order covers the trade-offs.
Step 5: Stop and target
The stop goes beyond the sweep low, because if price trades back through the low that was just raided, the idea is wrong. The first target is the opposing liquidity: in a bullish setup, the buy-side liquidity above the range high or the previous day high.
Where optimal trade entry (OTE) fits
Optimal trade entry is ICT's name for a pullback into the 62% to 79% Fibonacci retracement zone of the displacement leg, with the 70.5% level often cited as the sweet spot. In practice traders use OTE as a confluence check: an FVG or order block that sits inside the OTE zone, and in the discount half of the range for a long, is considered a higher quality entry than one that does not.
Premium and discount: buying low within the range
ICT traders split the current dealing range at its 50% level, called equilibrium. The upper half is premium and the lower half is discount. The rule of thumb is to look for longs in discount and shorts in premium, so you are not buying near the top of the very range you expect to break. The chart below shows a dealing range split this way, with the pullback reaching into the discount half before continuing.
Time: kill zones and the silver bullet
ICT puts unusual weight on time of day. The idea is that the cleanest liquidity raids and displacement moves tend to happen when large sessions open and volume arrives, while the middle of the Asian session and the lunch hours are more likely to chop. The windows below are the standard kill zones, quoted in New York time.
- Asian range (20:00 to 00:00): usually quiet. Its high and low become the liquidity that London often raids.
- London open (02:00 to 05:00): frequently the first sweep of the day, often of the Asian high or low.
- New York open (07:00 to 10:00): the busiest window for forex, index and gold traders, overlapping with London and with US data releases at 08:30.
- London close (10:00 to 12:00): London desks wind down; moves can retrace or extend the day's range.
If you trade from another time zone, convert these windows and remember that daylight saving changes shift them for part of the year. Our guide to forex market hours explains how the sessions overlap.
The ICT silver bullet, briefly
The silver bullet is a time based ICT model: a one hour window in which you look for a fair value gap that forms after a liquidity sweep, and trade it toward the nearest liquidity. The windows most often quoted are 03:00 to 04:00, 10:00 to 11:00 and 14:00 to 15:00 New York time. It is the same sweep, shift, FVG logic as the main setup, compressed into a narrow window.
News and kill zones
The New York kill zone overlaps with the biggest scheduled releases. Price often spikes through a level on the release and reverses minutes later, but spreads widen and stops can slip. Read our guide to NFP trading before you try to trade a sweep around a major release.
Risk management and reward-to-risk
A clean ICT setup with a tight stop below the sweep low often offers a large reward-to-risk on paper. That is attractive, but it also means a low win rate can still be profitable, and a high win rate is not required. The chart below shows the break-even win rate for each reward-to-risk ratio.
At 1:1 you need to win half your trades just to break even. At 1:3 you only need 25%. This is why ICT traders usually aim for the opposing liquidity rather than taking quick profits: the structure of the setup is built around fewer, larger winners. The flip side is that strings of losses are normal, and your sizing has to survive them. The risk-reward ratio explained guide goes deeper on the maths.
Practical rules that suit ICT trading:
- Risk a fixed small percentage per trade. Size the position from the distance between entry and the stop beyond the sweep, using a tool such as the position size calculator.
- Do not widen the stop. If price trades back through the swept low, the premise is gone.
- Define the target before entry. If the opposing liquidity is less than about 1:2 away, many traders skip the trade.
- Cap trades per session. One or two attempts per kill zone stops a missed setup from turning into revenge trading.
A simple ICT checklist
If you cannot tick each line honestly, wait.
- Higher timeframe bias is clear, and I know which liquidity is the draw.
- Liquidity is marked: session highs and lows, previous day high and low, equal highs or lows.
- I am inside a kill zone or silver bullet window.
- A sweep has happened, with a close back inside the range.
- Displacement has broken structure on a candle close.
- A fair value gap or order block exists, ideally in discount for longs or premium for shorts.
- The stop sits beyond the sweep extreme and the target is the opposing liquidity, at least 1:2 away.
- Position size is calculated from my fixed risk, and there is no major news release inside my holding window unless I planned for it.
Limits and criticism of ICT trading
- It is subjective. Two traders can mark different swing points, different order blocks and different ranges on the same chart. A framework with many optional confluences can explain almost any outcome after the fact.
- Chart examples are hindsight. Every textbook diagram, including the ones in this series, is chosen because it worked. In real time you see several sweeps that fail and gaps that never fill.
- The terms describe patterns, not proof of intent. A wick below equal lows is consistent with stops being run, but the chart cannot tell you who did it or why.
- Much of it is not new. Stop runs, supply and demand zones, gaps and session timing were studied long before ICT. The Wyckoff accumulation model, for example, describes a "spring" that is very close to a sell-side sweep.
- There is no guaranteed edge. We are not aware of independent, published evidence that ICT setups are profitable as a whole. Treat the method as a set of hypotheses to test on your own market and timeframe.
The practical answer to these criticisms is the same: write down precise rules, backtest them, forward test on a demo or simulated account, and track the results. Balance it with an understanding of why price moves in the first place, which is where fundamental vs technical analysis is worth a read.
Using ICT in a prop challenge
ICT setups are popular with prop traders because they define a tight invalidation point. That helps, but the evaluation rules matter more than the setup. At Velotrade, every plan uses a static maximum drawdown and a daily loss limit:
| Plan | Daily loss limit | Max drawdown (static) |
|---|---|---|
| CLASSIC 2-Step | 5% | 10% |
| CLASSIC 1-Step | 4% | 7% |
| PRO 1-Step | 3% | 3% |
The daily loss limit resets every day at 00:30 UTC and is set from the higher of your balance or your equity at that moment. The static maximum drawdown stays fixed from your starting balance for the life of the account; our guide to static maximum drawdown explains how that works.
How this shapes an ICT trader's plan:
- Size from the limits, not from conviction. On a PRO 1-Step with a 3% daily limit, three full losses at 1% each would end your day. Many traders risk well under 1% per setup on tighter plans.
- Respect the kill zone budget. If the London setup loses, the New York setup is not a chance to win it back with larger size.
- Plan around news. News trading is allowed on Velotrade plans, but a sweep on a data release can gap past your stop. Decide in advance whether you trade those windows.
- Pick your market. ICT concepts are applied to forex, indices, commodities such as gold, and crypto. Each has its own sessions and volatility, so backtest on the market you will trade.
For a broader plan of attack, read how to pass a crypto prop challenge, then compare the challenges to find the rule set that suits your risk per trade.

Whatever you trade, keep a journal of every ICT setup you take and every one you skip. After 50 to 100 entries, your own data will tell you more about which concepts work for you than any video.
Ready to trade with $200,000 capital?
Explore challengesFrequently Asked Questions
About the author

Gianluca Pizzituti
Chief Executive Officer
Formerly on the derivatives desk at Dresdner Kleinwort in London, then founded and ran a proprietary HFT firm in FX and equity indices out of Singapore.
View author page