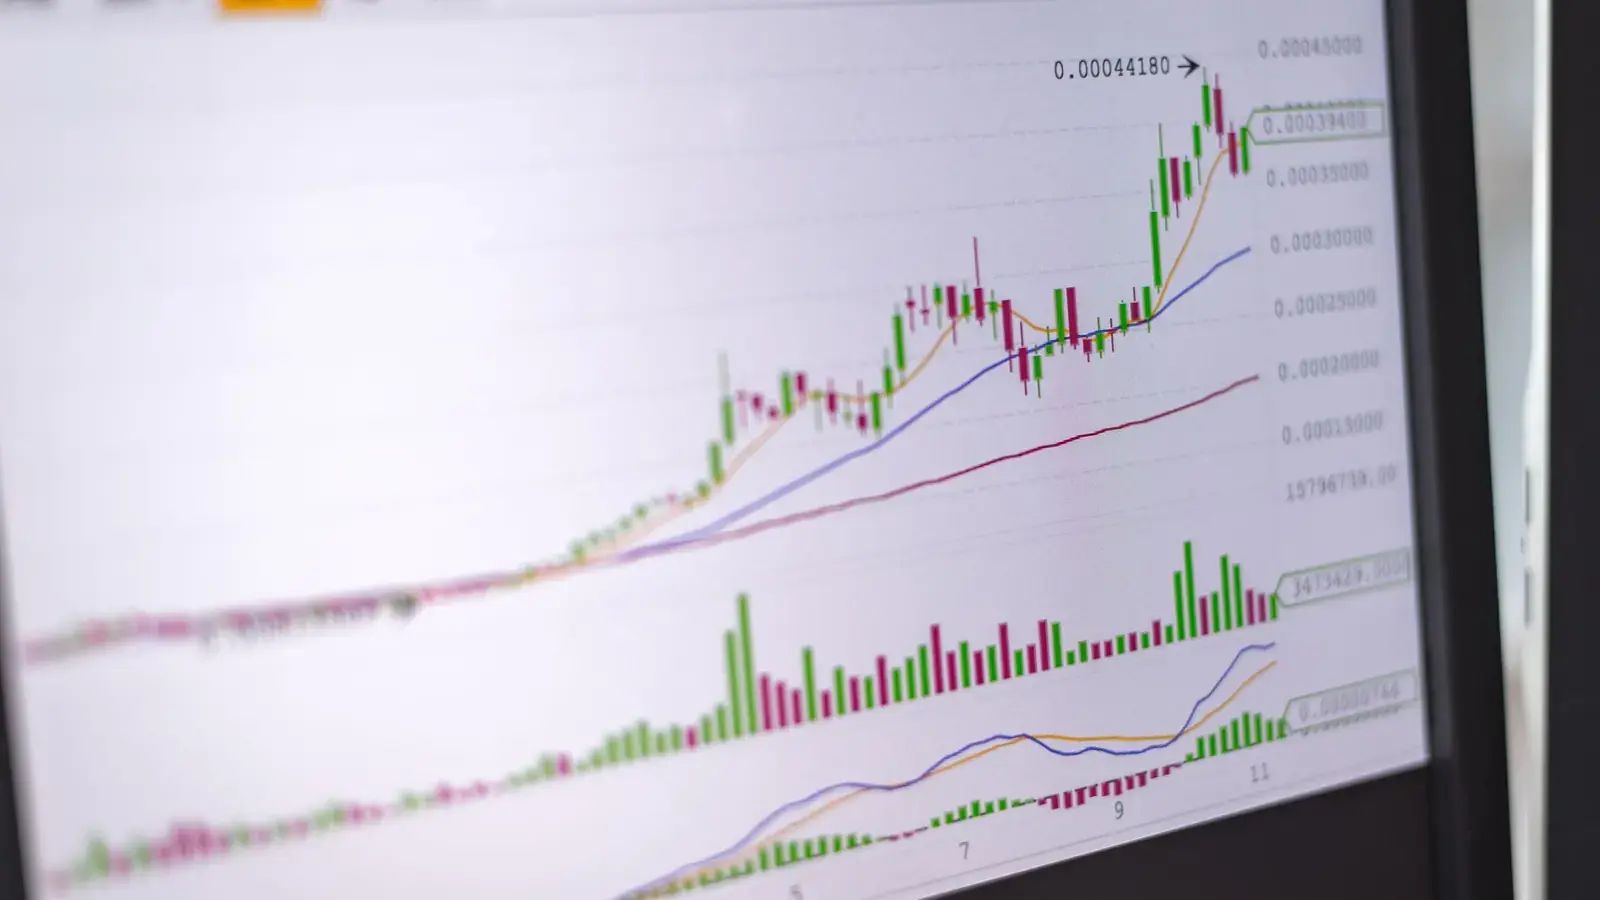
An order block is the last opposing candle before a strong, impulsive move that breaks market structure. A bullish order block is the last down candle before a rally that takes out a prior swing high; a bearish order block is the last up candle before a sell-off that breaks a prior swing low. Traders mark that candle as a zone and look to enter when price returns to it.
The concept comes from ICT trading, the framework popularised by Michael J. Huddleston ("The Inner Circle Trader"), where it is one of the two main entry tools alongside the fair value gap. This guide covers how to mark a block, what makes one valid, breaker and mitigation blocks, and how to trade them with defined risk.
Highlights of this article
- An order block is the last opposing candle before a displacement that breaks structure; no break of structure, no order block
- Mark it from the full candle range or from the body, and watch the mean threshold at 50% of the block
- The strongest blocks leave a fair value gap behind them and are still unmitigated when price returns
- A breaker block is a failed order block that flips to act from the other side
- "Order block" is a retail label for a footprint of real order flow, not something banks literally trade, so backtest before you rely on it
Ready to get funded?
Trade up to $200,000 in firm capital with static drawdown, no consistency rule, and payouts within 24 hours. Pass the challenge and keep up to 90% of your profits.
What is an order block?
In ICT terms, an order block is the final candle that moved against the coming direction before price displaced away from it. Three conditions define it:
- An opposing candle. For a bullish block, a down candle. For a bearish block, an up candle. If several opposing candles sit together, traders take the last one or group the cluster.
- Displacement. The move away is fast and one-directional: large bodies, little overlap, often leaving a gap in price.
- A break of structure. The displacement closes beyond a meaningful swing point. This is what separates an order block from any candle before any move. If reading swing points is new to you, start with break of structure, the step that comes right before the entry in the ICT sequence.
The logic: a sharp move that breaks structure suggests one side became aggressive, and the candle before it is the last area price traded before that, so traders expect a reaction there.
Bullish order block
In the chart below, the last down candle before the rally is marked as the bullish order block. The rally closes above the prior swing high (the BOS level), which confirms the block. Several candles later, price returns into the zone and holds, which is where an order block trader looks for a long.
Bearish order block
The bearish case is the mirror image. In the next chart, the last up candle before the sell-off is the bearish order block. The drop breaks the prior swing low, and when price rallies back into the block, it fails and turns lower.
How to mark an order block
Pick one marking convention and test it consistently rather than switching trade to trade.
Full range vs body
- Full range (high to low). The zone covers the whole candle including wicks, as in the charts above. Price reaches it more often, but the stop is wider.
- Body only (open to close). Tighter zone, smaller stop, better reward-to-risk on paper, but price more often reacts without fully reaching it.
A common compromise is to use the body for the entry and the wick extreme for the stop.
The mean threshold
The mean threshold is the 50% level of the block, the midpoint between its high and low. Price can trade into the upper half of a bullish block and the block is still intact, but a candle that closes through the mean threshold is a warning that it may be failing. Using the prices in the bullish chart, a block from 99.40 to 100.50 has a mean threshold of 99.95.
Timeframe
Order blocks appear on every timeframe, and on a one-minute chart there are dozens a day. A common workflow is to mark four-hour or daily blocks as areas of interest, then drop to a lower timeframe for the entry inside them.
What makes an order block valid
Most disputes come from marking candles that do not meet the definition. A checklist:
- It broke structure. The move away closed beyond a swing high (bullish) or swing low (bearish). A wick through a level is not a break.
- It displaced, ideally leaving a gap. The best blocks have a fair value gap right next to them, a three-candle imbalance where the first and third candles' wicks do not overlap.
- It is unmitigated. Price has not returned to the block since it formed. Once revisited, many traders consider it used up.
- It took liquidity first. The strongest setups form right after a liquidity sweep: price runs stops beyond an obvious high or low, then reverses hard and breaks structure.
- It sits at a sensible price. A bullish block in the discount half of the current range (below 50%) is preferred, and a bearish block in the premium half.
Breaker blocks and mitigation blocks
Breaker block
A breaker block is an order block that failed. Instead of holding, price trades through it and breaks structure the other way, and the old zone flips: a broken bearish block becomes potential support, a broken bullish block potential resistance.
In the chart below, price drops through the prior low, sweeping the sell stops beneath it. The last up candle before that drop (what would have been a bearish order block) is then broken to the upside as price reverses. When price comes back to that zone, the retest holds as support.
The sweep is the key detail. It suggests the earlier drop was a stop run rather than a genuine trend change, which is why the zone is expected to hold on the retest.
Mitigation block
A mitigation block is the same flip without the sweep: price fails to make a new low (or high), then breaks the opposing block, and the retest of that zone is the trade. Without the liquidity grab, most traders treat it as the weaker of the two.
How to trade an order block
The ICT sequence is: liquidity sweep, displacement with a break of structure, entry at the order block or fair value gap, target at the opposing pool of liquidity.
Entry
- Limit at the block edge (top of a bullish block, bottom of a bearish one). Most fills, worst price. The trade-offs of resting orders are covered in market order vs limit order.
- Limit at the mean threshold. Better price and reward-to-risk, fewer fills.
- Confirmation entry. Wait for price to enter the block, then wait for a lower-timeframe break of structure in your direction and place a limit order at the zone it leaves. Fewer false entries, but a worse price.
Stop and target
Place the stop beyond the far side of the block, plus a buffer for spread. The usual target is the next obvious liquidity in the trade's direction: the swing high the displacement broke, equal highs, or a prior day's high. Size the trade so the distance to your stop equals the amount you are willing to lose; the position size calculator does that maths, and the risk-reward ratio guide shows the win rate each reward-to-risk needs.

Order block vs supply and demand zones
Both say price left an area quickly and may react there again. The difference is how strictly the zone is defined.
| Order block | Supply and demand zone | |
|---|---|---|
| Zone source | One candle: the last opposing candle | The base or consolidation before a strong move |
| Size | Usually narrower | Often wider, several candles |
| Confirmation | A break of structure | A strong departure, structure break not always required |
| Framework | ICT and smart money concepts | Classic price action |
A demand zone often contains a bullish order block, with the block acting as a refined entry inside it. The stricter ICT version filters weak zones, but its tighter stops are also easier to hit.
Order block vs fair value gap
Both are created by the same displacement, so they often sit side by side. The order block is the candle before the move; the fair value gap is the imbalance inside the move. Traders who want a shallower entry use the gap, and those who want a deeper one use the block. When price returns, it often fills the gap first and then tests the block.
The institutional reality check
ICT material often says order blocks are where banks "placed their orders." That is a simplification. Real desks work client orders and hedge exposures, filling large orders in pieces over time, and much of the flow that moves price is client business and hedging, not a view on a fifteen-minute candle. No desk is waiting at the low of one down candle on a fifteen-minute chart. Vittorio's write-up on order flow trading covers how that flow really behaves.
What an order block captures is a footprint. When price leaves an area with displacement and breaks structure, something in the order flow changed there, and price sometimes returns as remaining interest gets filled. Wyckoff described similar behaviour as accumulation and distribution; see Wyckoff accumulation explained for that older lens.
Two limits are worth stating plainly. Marking blocks is subjective, and textbook examples, including the charts in this article, are chosen after the fact. Many blocks that look identical in real time fail. Define your rules, backtest them, and forward test before trusting them.
Common order block mistakes
- No break of structure. Every move has a last opposing candle. Without a structure break, it is just a candle.
- Ignoring mitigation. Trading a block that price has already revisited or fully traded through.
- Fighting the bias. Buying a bullish block in a clear downtrend or in the premium half of the range without a sweep and a structure shift.
- Stops inside the block. A stop at the mean threshold gets hit on normal noise. Stop beyond the full block or skip the trade.
- Trading through news. High-impact releases can blow through any zone. Know the calendar and the session; forex market hours covers when volatility picks up.
Order blocks in a prop challenge
Order block entries define the stop before you enter, which makes fixed-fraction sizing easy.
All Velotrade challenges use a static maximum drawdown, a fixed dollar floor set at activation: 10% on CLASSIC 2-Step, 7% on CLASSIC 1-Step and 3% on PRO 1-Step. The daily loss limit (5%, 4% and 3% respectively) resets every day at 00:30 UTC and is set from the higher of your balance or equity at that moment. Static maximum drawdown explained walks through the floor in detail.
- Risk small per block. Several blocks in a row can fail. At 0.5% per trade a losing streak stays well inside a daily limit; at 2% a few failures can end the day.
- Avoid stacking entries. Taking the fair value gap and the order block below it as separate full-size trades doubles your exposure to one idea.
- Plan around news. News trading is allowed, but slippage around releases can push fills beyond a tight block stop.
To practise a rules-based approach on a simulated account, see the Velotrade challenges across forex, crypto, index ETFs, stocks and commodities. This article is educational only and is not investment advice.
Ready to trade with $200,000 capital?
Explore challengesFrequently Asked Questions
About the author

Vittorio De Angelis
Executive Chairman
Former equity-derivatives trader at JP Morgan, Dresdner Kleinwort and Bank of America in London. Later Head of Brokerage at a global broker in Hong Kong.
View author page