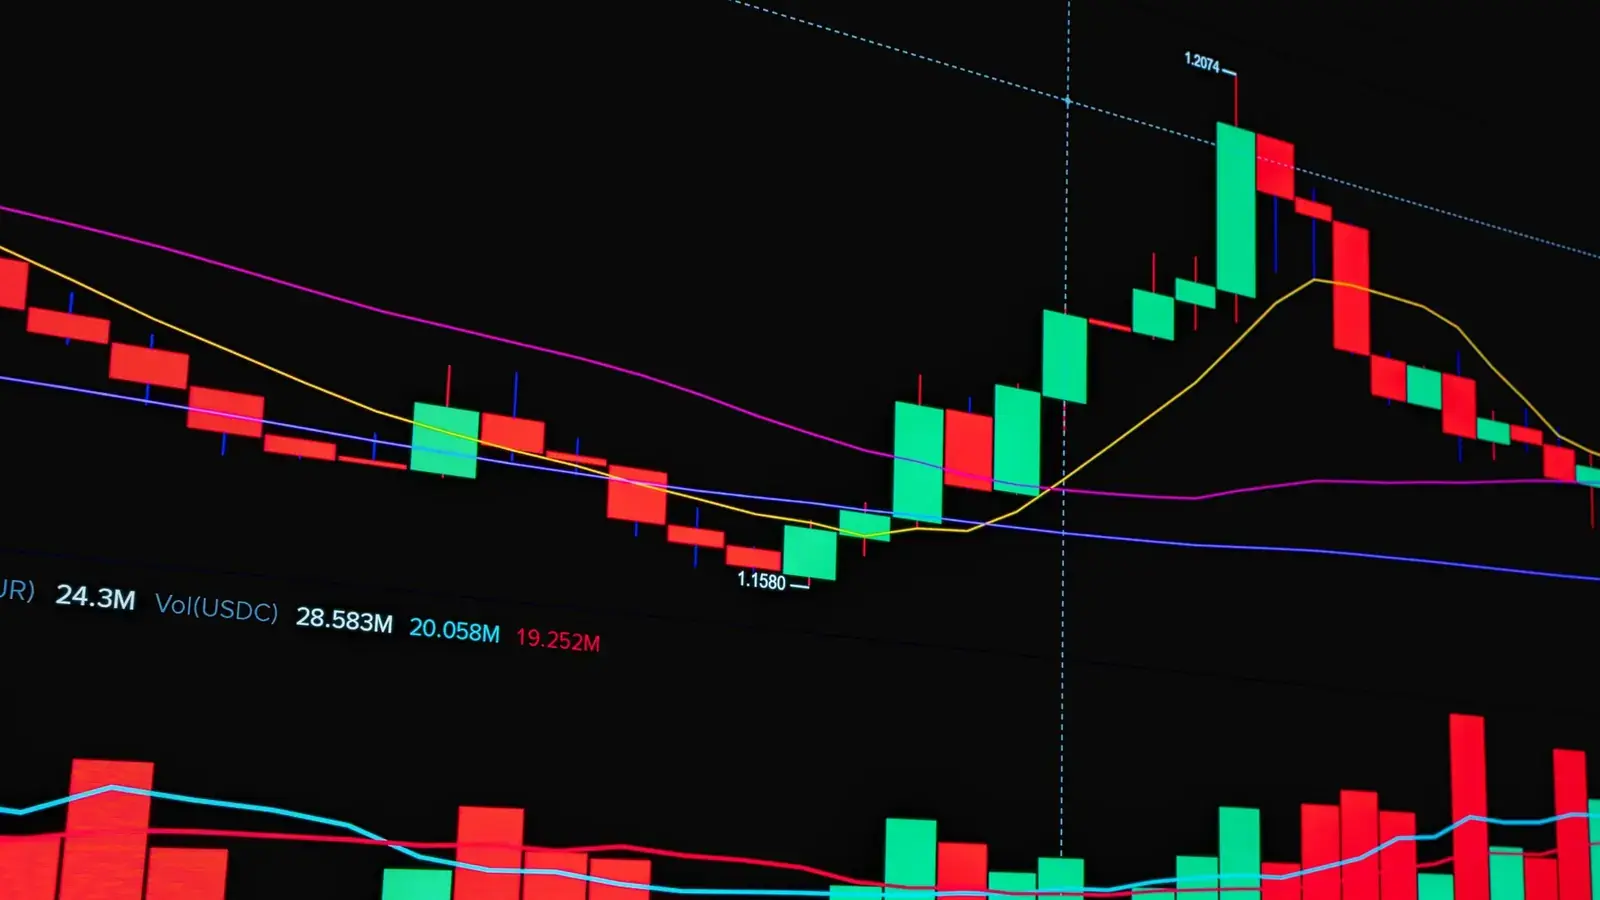
A break of structure (BOS) is when price closes beyond the most recent swing high in an uptrend, or the most recent swing low in a downtrend, confirming that the trend is continuing. A change of character (CHoCH) is the opposite signal: the first close beyond the swing that was defending the trend, a warning that the trend may be ending. Together they are the market structure language at the heart of ICT trading and smart money concepts.
Below: how to read structure, define a valid swing, confirm a break, tell BOS from CHoCH and MSS, and frame entries after a liquidity sweep.
Highlights of this article
- Market structure is the sequence of swing highs and lows: higher highs and higher lows in an uptrend, lower highs and lower lows in a downtrend
- A break of structure (BOS) is a candle close beyond the last swing in the direction of the trend, a continuation signal
- A change of character (CHoCH) is the first close against the trend, beyond the swing that was protecting it
- A market structure shift (MSS) is the ICT term for a CHoCH with displacement, usually right after liquidity is swept
- Count breaks on candle closes, not wicks: a wick through a level is often a sweep, not a break
- In the ICT sequence the break is step two: sweep, break, then an entry on the fair value gap or order block the break left behind
Ready to get funded?
Trade up to $200,000 in firm capital with static drawdown, no consistency rule, and payouts within 24 hours. Pass the challenge and keep up to 90% of your profits.
What market structure is
Market structure is the shape of price swings. Every trend is a series of pushes and pullbacks, and each one leaves a turning point: a swing high where price turned down, and a swing low where price turned up. Compare each new swing with the one before it and you get four labels:
| Label | Meaning | What it suggests |
|---|---|---|
| HH (higher high) | Peak above the previous peak | Buyers are pushing further |
| HL (higher low) | Trough above the previous trough | Buyers are stepping in earlier |
| LH (lower high) | Peak below the previous peak | Sellers are stepping in earlier |
| LL (lower low) | Trough below the previous trough | Sellers are pushing further |
An uptrend is a run of higher highs and higher lows. A downtrend is a run of lower highs and lower lows. When highs and lows overlap without a clear sequence, the market is ranging, and structure signals inside the range carry little weight.
The idea predates ICT: Dow Theory and Wyckoff read trends the same way. ICT added a vocabulary for the breaks and the habit of reading them alongside liquidity.
How to define a valid swing
The hard part is deciding which swings count. Mark too many and every wiggle becomes a "break"; too few and you miss the turn. A practical definition:
- Use a fractal rule. A swing high is a candle whose high is above the highs of the candles on either side (three candles minimum, five for fewer, cleaner swings). Mirror it for swing lows.
- Require the swing to cause a move. A valid swing high should be followed by a pullback that takes out the low of the candle that made it. A one-candle pause in a strong rally is not a swing.
- Mark swings on your structure timeframe. A swing on the 5-minute chart is noise on the 4-hour chart. Pick the timeframe first, then mark only swings that are obvious on it.
- Find the protective swing. In an uptrend, the key level is the higher low that launched the move to the latest high. That is the level a CHoCH has to break.
What a break of structure is
A break of structure (BOS) happens when price closes beyond the most recent swing in the direction of the existing trend: above the last swing high in an uptrend, or below the last swing low in a downtrend. A BOS says the trend is still in control.
In the chart below, price prints a higher low at 100.80, then closes above the prior swing high at 102.00: the first BOS. The rally tops out at a higher high of 103.50, pulls back to a new higher low at 102.20, then closes above 103.50 for the second BOS and runs on to the next higher high at 104.80.
Each BOS is followed by a pullback that holds above the previous higher low. While that rhythm continues, traders look for longs on the pullbacks.
Body close or wick: the BOS debate
There are two schools on what confirms a break:
- Wick break: any trade beyond the swing counts. Earlier signals, but many false ones, because price often pokes through a high to trigger stops and then reverses.
- Body close: the candle must close beyond the swing. Slower, but it filters out most stop runs.
Most structure traders, and the chart above, count breaks on closes. Stop and breakout orders cluster just beyond obvious highs and lows, so a wick through a level and straight back is frequently a liquidity sweep, not a break. A close shows price was accepted beyond the level for at least one full candle.
What a change of character (CHoCH) is
A change of character (CHoCH) is the first break against the trend. In an uptrend it is a close below the most recent higher low, the swing that launched the last push to a new high. In a downtrend it is a close above the most recent lower high.
In the chart below, the uptrend breaks structure at 103.50 and makes a higher high at 104.80. The pullback that follows does not hold: price closes below 102.20, the last higher low, and that close is the change of character.
A CHoCH is a warning, not a guarantee; it can be a deeper pullback inside a larger uptrend. Many traders stop looking for longs and wait for a lower high and a bearish BOS before acting.
Market structure shift (MSS)
Market structure shift (MSS) is the term Michael J. Huddleston, known as The Inner Circle Trader, uses for a specific kind of change of character: a break of the short-term swing against the trend that comes right after a liquidity sweep and happens with displacement, meaning large, fast candles that often leave a fair value gap behind.
Many traders use the terms interchangeably. The useful distinction is context: a slow drift below a higher low is weaker than a displacement through it after a sweep.
BOS vs CHoCH: the key differences
| Break of structure (BOS) | Change of character (CHoCH / MSS) | |
|---|---|---|
| Direction | With the trend | Against the trend |
| Level broken | Last swing high (uptrend) or swing low (downtrend) | Last higher low (uptrend) or lower high (downtrend) |
| What it signals | Trend continuation | First sign of possible reversal |
| How often | Many times in a trend | Once, at the turn |
| Typical use | Join pullbacks in the trend direction | Stop trading the old trend, prepare for the new one |
| Best confirmation | Close beyond the swing | Close beyond the swing, ideally with displacement after a sweep |
A simple way to remember it: a BOS breaks the level the trend is attacking, a CHoCH breaks the level the trend was defending.
Internal vs external structure
Structure traders separate two layers:
- External structure is the major swing high and low of the current leg on your main timeframe.
- Internal structure is the smaller swings inside that leg, visible on a lower timeframe.
A common mistake is reading an internal CHoCH as a full reversal. If the 4-hour trend is up and the 5-minute chart prints a CHoCH down, that is usually just the 4-hour pullback starting, often the retracement you want to buy later.
Timeframe alignment
A workable approach gives each timeframe one job:
- Higher timeframe (daily or 4-hour): define the bias. Was the last BOS up or down?
- Setup timeframe (1-hour or 15-minute): wait for a pullback into a zone in line with that bias, often after a liquidity sweep.
- Entry timeframe (15-minute or 5-minute): mark the CHoCH or MSS back in the higher timeframe direction, then place a limit order at the zone it leaves behind. You do not need to watch every candle.
When the timeframes disagree, standing aside is a valid decision.
Using structure to frame entries
A break tells you direction, not where to enter; chasing the break candle means a poor price and a wide stop. In the ICT approach, structure is step two:
- Liquidity is taken. Price sweeps a pool of stops, such as equal lows or the low of the overnight range.
- Displacement breaks structure. A strong reversal closes through the nearest opposing swing. This is the BOS or MSS.
- Entry on the retrace. Price pulls back into the fair value gap or order block the displacement left behind.
- Target opposing liquidity. The take-profit sits at the next pool of stops on the other side.
The chart below shows the full sequence: the sell-side sweep below the overnight range, the BOS through 101.50, the entry in the fair value gap on the retrace, and the target at buy-side liquidity above.
- Entry: a limit order inside the fair value gap or order block, not a market order on the break candle. For the mechanics of resting orders at a level, see market order vs limit order, which explains why resting limit orders suit this kind of entry.
- Stop: beyond the swing that was swept. In a long, below the sweep low. If price trades back through it, the setup is invalid.
- Target: the next liquidity pool in the direction of the break, such as the prior swing high or equal highs.
If the distance to target is not a reasonable multiple of the distance to the stop, skip the trade. The risk-reward ratio guide shows the break-even win rate for each ratio, and the position size calculator turns the stop distance into a size. Breaks during the London and New York opens tend to carry more follow-through (see forex market hours).
Common mistakes with BOS and CHoCH
- Counting wick breaks. A wick above a high that closes back below is more often a sweep than a BOS. Wait for the close.
- Marking swings that are too small. Every wiggle becomes a CHoCH.
- Mixing timeframes. An internal CHoCH on the 1-minute chart says little about a daily uptrend.
- Entering on the break candle. The entry comes on the retrace into the zone the break left behind.
- Trading structure inside a range. When highs and lows overlap, breaks flip back and forth.
- Trusting tidy textbook charts. Examples look obvious in hindsight; in real time some breaks fail. Backtest your exact rules first.
ICT and smart money concepts are discretionary frameworks, not proven systems. The labels describe what price did, not what institutions intend; the forces underneath are liquidity and order flow, covered from a bank desk perspective in our order flow trading guide.
Applying market structure in a prop challenge
Structure suits a funded challenge because the setup defines the stop: the trade is wrong if price closes back through the swept swing.
- Size from the stop. Decide the dollar risk first, then size so the stop distance equals that amount. A wide stop means a smaller position, not more risk.
- Respect the daily loss limit. On Velotrade it is 4% on the CLASSIC 1-Step, 5% on the CLASSIC 2-Step, and 3% on the PRO 1-Step. A few failed breaks in a row add up, so cap your attempts per day.
- Know your drawdown floor. All plans use static maximum drawdown (7%, 10% and 3% respectively), a fixed floor set from your starting balance. See static maximum drawdown explained.
- Be deliberate around news. News trading is allowed, but releases such as NFP often sweep both sides of a range first, which produces fake breaks. Many traders wait for the first close after the release.
The same breaks appear on forex, indices, crypto and commodities such as gold, all on one account. To test your rules under challenge conditions, compare the challenges.
Velotrade is unregulated and offers educational, simulated evaluations with real-time market pricing. It is not a broker, dealer, or custodian, and nothing in this article is investment advice.

Ready to trade with $200,000 capital?
Explore challengesFrequently Asked Questions
About the author

Gianluca Pizzituti
Chief Executive Officer
Formerly on the derivatives desk at Dresdner Kleinwort in London, then founded and ran a proprietary HFT firm in FX and equity indices out of Singapore.
View author page