Order flow trading means reading the actual buying and selling behind a price, rather than only the chart that buying and selling leaves behind. Every candle is the end result of orders: who paid up, who sold down, and how much size sat at each level. Order flow traders try to watch that process as it happens.
It is a useful skill with a hard limit, and that limit has a name: information asymmetry. The largest flows in any market are often negotiated privately, hedged in pieces, and known to a handful of people at a bank before they reach a screen. Vittorio De Angelis, Velotrade's co-founder, spent more than 30 years on institutional desks (equity derivatives at JP Morgan, Dresdner Kleinwort and Bank of America) and sat on the inside of exactly those trades. This guide explains the tools of order flow, then uses his stories to show what those tools cannot see.
Highlights of this article
- Order flow is the stream of buy and sell orders hitting a market; the order book shows resting orders, the tape shows what actually traded
- Footprint charts, volume profile and delta show where volume traded and whether buyers or sellers were the aggressors
- Institutional flows (block trades, corporate derivative deals, central bank and hedge fund orders) are mostly invisible to retail until price has already moved
- Dealers delta hedging derivatives create large mechanical flows that can distort prices in the short term, regardless of fundamentals
- The practical edge for a retail or prop trader is respecting these flows: trade liquid windows, respect news times, size for gaps, and do not fight a large flow
Ready to get funded?
Trade up to $200,000 in firm capital with static drawdown, no consistency rule, and payouts within 24 hours. Pass the challenge and keep up to 90% of your profits.
 5:19
5:19Read the transcript
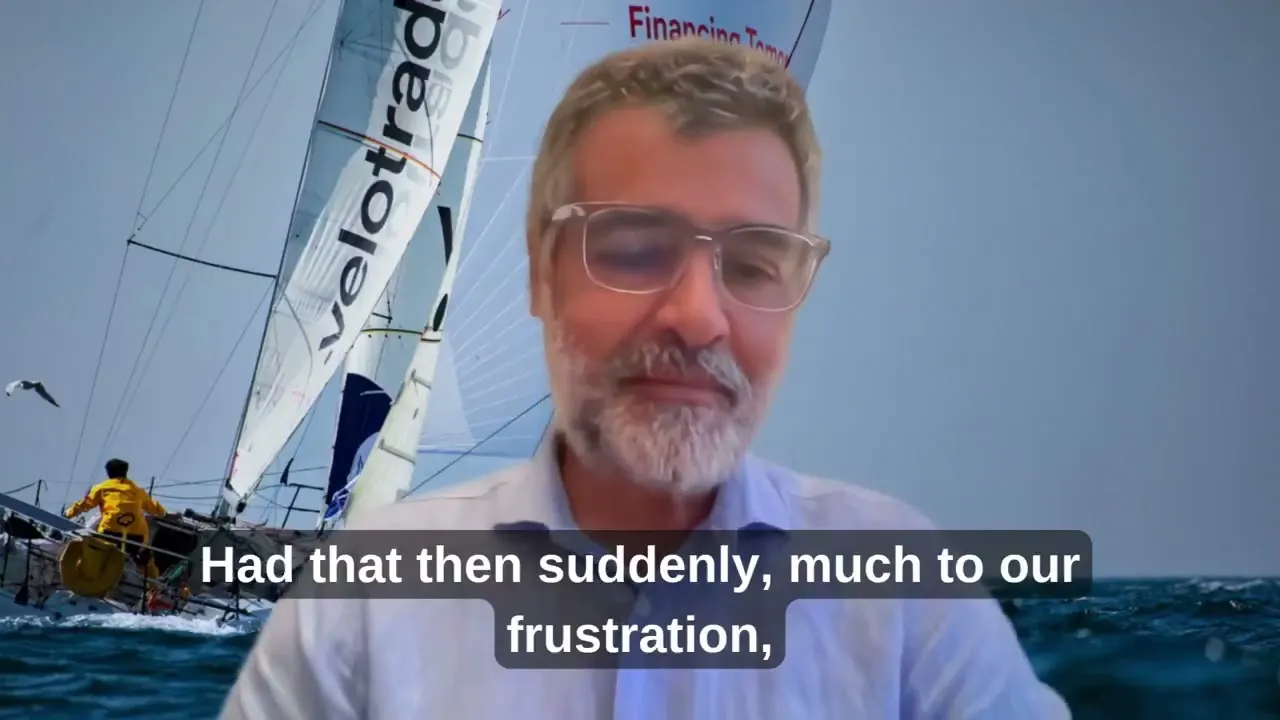
Another couple of stories from the famous good old days at the bank. The stories I want to talk about show that retail is at a great disadvantage vis-à-vis the institutional players in the market.
You can do all your technical analysis, you can do all your fundamental analysis, but there is always going to be an information asymmetry between you, the individual trader, and a financial institution.
The first example happened quite a few years ago. I can't give you the name of the company. It's one of the largest apparel retailers in the world, and one of its main shareholders decided to sell a very large holding.
I was at Dresdner Bank at the time, so our bankers called us and gave us the details of the trade. It would have been a massive trade. The block was about 50% of the value of the company.
It was going to be a derivative transaction, so it would have ended up as selling calls and buying puts, and the delta would have been executed in the market. It was quite a complicated structure. We worked on it for quite a few days, if not weeks.
And again, when I talk about information asymmetry, a retail player would know nothing about that trade. We were behind the wall on this. We also had to be very careful about discussing the matter with anybody else.
And then suddenly, much to our frustration, the seller decided not to proceed, which with hindsight was a great decision. The transaction didn't happen.
But the reason I'm mentioning it is that, had it happened, the market would have been flooded with almost 50% of the float of that company. A retail player who had positioned themselves based on, let's say, publicly available information would have had no knowledge of this, and that event would have had a dramatic effect on prices.
Another thing I found interesting: in my first job, at J.P. Morgan, I was sitting next to the FX desk. We all had Bloomberg terminals, so we could see prices in real time.
But what was very surprising is that sometimes from the FX desk I would hear prices that were a whole figure, if not two figures, away from the bid and offer I saw on the screen.
What does that mean? It means the FX desk at J.P. Morgan was getting orders from, realistically, very large hedge funds, or maybe even the treasuries of foreign countries. The flows were so large that the price was moving faster than the Bloomberg terminal could record.
So imagine you're retail. You are looking at your levels, you're doing your technical analysis, and FX is a very liquid market, so you think your levels are going to hold. You have all your theories about why that's going to happen. And then suddenly a country or a hedge fund decides to put on a position, and all your work doesn't hold anymore.
You could argue that technical analysis, when done properly, should actually help you forecast these kinds of moves. But the point is that many of these moves, at least in their timing, are impossible to predict.
Of course the trader at J.P. Morgan knows what's going on, and traders at other banks may have an inkling too, because that client probably asked them for a price as well. Either way, the institutional side is way ahead of retail.
I don't want this to be too disheartening, but do realize that behind the screens, behind the prices, there are massive flows going on that you will never have any perception of. You can try to benefit from these moves if you trade at very high frequency, or you'll be on the wrong side of the trade. So just be aware of it.
Again, knowledge is power. Knowing that these kinds of flows can happen, and that they're out of your control, should help you position yourself and make wiser decisions when you trade. Thank you.
What is order flow?
Order flow is the sequence of orders sent to a market. Some are passive: limit orders resting at a price, waiting to be filled. Some are aggressive: market orders that cross the spread and take whatever liquidity is there. Price moves when aggressive orders consume the passive liquidity at one level and have to move on to the next.
A chart tells you price rose from 100 to 101. Order flow tries to tell you how: aggressive buying, sellers stepping away, or a large passive buyer absorbing selling before the turn.
Bid, ask and the order book
The bid is the highest price someone will pay; the ask (or offer) is the lowest price someone will sell at; the gap is the spread. A trade happens when a buyer lifts the offer or a seller hits the bid, and which side initiated it is the most important fact in order flow analysis.
The order book (Level 2, or depth of market) lists resting limit orders at each price. Depth is how much size sits at each level: a thick book absorbs large orders with little movement, a thin one lets moderate orders push price several levels. Two cautions apply. The book shows intentions, not commitments, since orders can be cancelled in milliseconds and large players hide size with iceberg orders. And not every market has a single book: stock and crypto exchanges do, but spot forex is spread across banks and venues, so the depth a retail platform shows is only one slice.
Order flow tools in plain terms
Most order flow software builds on the same raw data: every trade, its size, its price, and whether it hit the bid or lifted the offer.
| Tool | What it shows | What it is good for |
|---|---|---|
| Time and sales (the tape) | Every executed trade, in sequence | Spotting unusually large prints and bursts of aggression |
| Depth of market | Resting limit orders at each price | Seeing where liquidity is thick or thin right now |
| Footprint chart | Volume traded at the bid and at the ask, at each price, inside each bar | Seeing who was aggressive at each level of a candle |
| Volume profile | Total volume traded at each price over a session or range | Finding high-volume "fair value" areas and thin zones |
| Delta and cumulative delta | Aggressive buy volume minus aggressive sell volume | Judging who is in control, and spotting divergences |
A footprint chart opens up each candle. If a bar closes up but most volume at the high was sellers hitting bids, the buying may have been absorbed. Volume profile turns the chart sideways, showing volume per price: the busiest price is the point of control, and price tends to move quickly through low-volume zones and slow down around high-volume nodes.
Delta, in order flow terms, is volume at the ask minus volume at the bid. Cumulative delta adds it up over time; a new price high without a new delta high suggests aggression is thinning. (This is not the options Greek discussed below.)
Information asymmetry: the part order flow cannot see
In economics, information asymmetry describes a transaction where one side knows materially more than the other. George Akerlof's 1970 paper "The Market for Lemons" made the idea famous, and he shared the 2001 Nobel Prize in economics with Michael Spence and Joseph Stiglitz for work on markets with asymmetric information.
In trading, it is less about secrets and more about position in the flow. A bank dealer asked to price a huge order knows the order exists before anyone else. That is not illegal insider trading (banks run strict information barriers around these situations), but it does mean the institution sees the wave forming while retail only sees it when it breaks.
"You can do all your technical analysis, you can do all your fundamental analysis, but there is always going to be an information asymmetry between you, the individual trader, and a financial institution." Vittorio De Angelis
The block trade that never happened
Vittorio's first example comes from Dresdner. The bank's corporate bankers brought the derivatives desk a potential deal for one of the main shareholders of one of the world's largest apparel retailers, who wanted to sell a holding worth roughly half the value of the company.
The plan was a derivative structure built from calls and puts, with the delta hedge executed in the market. The desk worked on it for days, if not weeks, "behind the wall": confidential, and not to be discussed with anyone outside the deal. Then the sale was called off. With hindsight that was a good decision for the sellers, because the stock went on to multiply.
Had it gone ahead, the market would have absorbed a flow equal to a huge share of the float, and anyone positioned on public information "would have had no knowledge of this." No chart or footprint would have warned them.
Prices a figure away from the screen
The second story comes from his first job at JP Morgan, sitting next to the FX desk. Everyone had Bloomberg terminals with real-time prices, yet he would sometimes hear the FX dealers quoting a whole figure, even two, away from the bid and offer on his screen. In FX a figure is 100 pips, a big gap in one of the most liquid markets in the world.
The explanation was flow. The desk was trading for very large clients, realistically major hedge funds or foreign treasuries, and the orders were so big that the real price moved faster than the terminal could show it. Traders at other banks may have had an inkling too, he adds, because the client had probably asked them for a price as well.
"Behind the screens, behind the prices, there are massive flows going on that you will never have any perception of." Vittorio De Angelis
Institutional vs retail order flow
The difference is not only size. Retail orders are small relative to the book, executed on screen, all at once, and fully visible once they trade. Institutional orders can exceed what the visible book holds across many levels, are worked over hours or days or negotiated off screen, and are driven as often by hedging, rebalancing, index changes and corporate needs as by a view on price. Crucially, the dealer pricing them knows before the market does.
Block trades
A block trade is a very large transaction, usually negotiated privately between a client and a bank rather than placed in the public order book. The bank may take the block onto its own book and hedge or distribute it gradually, which is why a block can appear on the tape as hours of persistent one-sided pressure rather than a single print.
Hedging flows and delta hedging
Some of the biggest flows in any market have nothing to do with anyone's opinion. They are hedges. When a dealer sells or buys options, the position has a delta (here, the options Greek): its sensitivity to a move in the underlying. To stay neutral, the dealer trades the underlying shares or futures to offset it. Our guide to institutional hedging covers the wider toolkit.
 5:24
5:24Read the transcript
A couple more stories from the trenches. War stories.
The reason I like sharing these stories is to make all investors aware that sometimes an investor sits in front of his screen, has access to a huge amount of information, is very good at looking at charts, but there are always elements that the investor will never know about, or is unlikely ever to know about. Two examples.
The first: I was trading RWE, which is a German utility company, and we had a corporate trade. We called them corporate trades when they were extremely large and generally initiated by a corporate.
The transaction entailed the client going synthetically long RWE, so the client was buying calls and selling puts. I'm not sure why he needed to do that. Maybe he was not allowed to buy more shares, maybe there was some corporate agreement that prevented him from increasing his exposure to the company further.
Anyway, it took us a couple of days, maybe a week, to price the transaction. It was very large. Eventually the client said done, and of course, as I was buying the puts and selling the calls, I had to go and buy the delta in the market, which was a very large transaction.
Then, once the transaction was booked, I also had to hedge the volatility, because this transaction put me very, very long vega. The strike of the put I was buying was much closer to the money than the call I was selling. And at the time I was not overly bullish on volatility. So I went out and sold two or three million dollars' worth of vega, which is a ton of options.
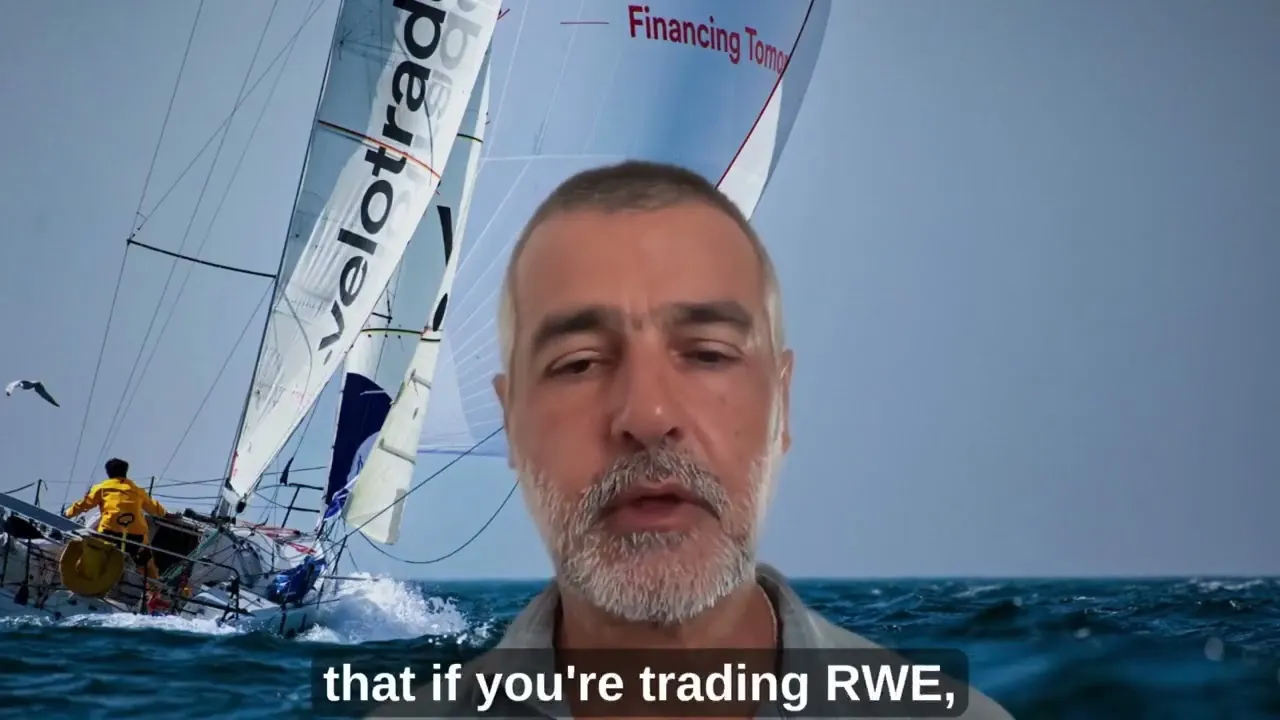
The reason I'm mentioning this is that if you are trading RWE, you can look at all the charts in the world, but you'll never know when the client says done to the investment bank, and you don't know when the bank is going to go out there and execute the delta.
In this case, I had to buy a very large amount of shares. I was buying puts, so I had to hedge the puts. I was selling calls, so I had to hedge those as well. And obviously the flows I was executing hugely distorted the market, at least in the short term.
I had an added bonus on that transaction, because buying puts and selling calls left me long dividends. As I mentioned previously, because of structured products, dividends were priced very low in the market. So when RWE eventually reported results and gave news on the dividend, I made a lot of P&L.
The second example actually cost me, as a professional, a fair amount of money. I believe it was January 2008. There was a trader at Société Générale, Jérôme Kerviel, who had experience in the back office, which is generally a somewhat dangerous combination.
Because once he came to the front office, he started trading and accumulated a massive rogue position. He was able to hide it because he knew how the back office worked. He knew the weaknesses of the reporting systems.
He built a long futures position on, I believe, the Euro Stoxx, the CAC and a bunch of European indices, of around 50 billion euros. When he was eventually caught, unwinding it cost the bank about 4.9 billion euros.
The reason I'm mentioning it is that I had some danger on the downside, meaning I had some structured products in my books that could be dangerous if the market went down. So I decided to buy options on the Euro Stoxx, to buy some gamma.
As I explained previously, if you are long options, the more the market moves, the more money you make. However, to hold long options you are paying theta. When you buy options you have to pay a premium, and that premium decays over time. It can be a really substantial amount of money.
So what happened there? Because Jérôme Kerviel was buying an enormous amount of futures, the market never actually went down. You had occasions on which the US opened 1% or 2% lower and Europe opened flat. Not because the correlation broke down, but because there was an individual buying a huge amount of futures at that level.
So of course my options never performed. They decayed slowly but surely, and it cost me a lot of money.
And that was as a professional, so I had very good access to information. Imagine if you're a retail trader trading the Euro Stoxx and there is an event like that happening. You're obviously at a disadvantage.
I'm not telling people not to trade. I'm sharing my experiences so that next time you think you know it all, you bear in mind that there is a certain amount of information that is not shared. Speak soon.
Vittorio saw how big these flows get on a corporate trade in RWE, the German utility. The client wanted to go synthetically long by buying calls and selling puts (perhaps the client could not buy more shares, or a corporate agreement stopped it). After days of pricing, the client said "done." Vittorio was now short calls and long puts, short delta on both legs, so he had to buy what he calls "a very large amount of shares" in the market.
Because the put he bought was much closer to the money than the call he sold, the trade also left him heavily long vega (exposed to rising volatility). He was not bullish on volatility, so he sold a large amount of vega back into the options market. His delta hedging on both legs "hugely distorted the market, at least in the short term."
His point for anyone trading RWE at the time: "You'll never know when the client says done to the investment bank." A trader on a footprint chart would have seen heavy, persistent buying with no way of knowing it was a hedge for a private contract, not a fundamental investor turning bullish. The same video covers another hidden flow, the concealed futures position behind the Jérôme Kerviel affair in early 2008.
Why big flows move price before charts show it
Four structural reasons stand out:
- The order exists before it trades. Blocks, corporate derivatives and central bank orders are negotiated in private. The dealer knows first.
- Dealers hedge ahead of and alongside the flow. Once a bank expects a flow, it adjusts its own risk, and that hits the market alongside or before the client order.
- Liquidity is thinner than the screen suggests. Visible depth is a fraction of real supply and demand, so a large order sweeps levels and price gaps.
- Indicators lag by design. Moving averages, oscillators and even delta are built from trades that already happened.
Analysis still helps, but as Vittorio says, "many of these moves, at least in their timing, are impossible to predict."
Practical takeaways for retail and prop traders
You cannot see the order before it reaches the bank. "Knowledge is power," as Vittorio says: knowing these flows exist should change how you position.
Trade the liquidity windows
Markets are deepest when major centers overlap: the London and New York overlap in forex, the regular session (especially the open and close) in US stocks and index ETFs. Thin periods, such as the hours after the US close in FX or quiet weekends in crypto, are where one large order moves price furthest.
Respect news and known flow times
Some large flows are predictable in timing if not direction: non-farm payrolls and other major data, central bank decisions, month-end and quarter-end rebalancing, index changes, options expiries (when dealer hedges shift quickly) and the London 4pm FX fix. Plan around them deliberately or stay flat.
Size for the gap, not the stop
If a flow can move price a figure through your level in seconds, your stop may fill well beyond where you set it. Size so a gap is survivable; a position size calculator helps you work back from the amount you are willing to risk. On a prop evaluation, a static maximum drawdown does not care whether the loss came from a bad idea or a bad fill. Execution matters too: in a fast, thin market, limit orders rather than market orders stop you from being the liquidity a large flow sweeps through.
Do not fight a large flow
When the tape shows persistent one-sided aggression absorbing everything in its path, assume someone bigger knows something, or simply has to get done. Standing in front of it because "the level should hold" is how retail ends up on the wrong side.
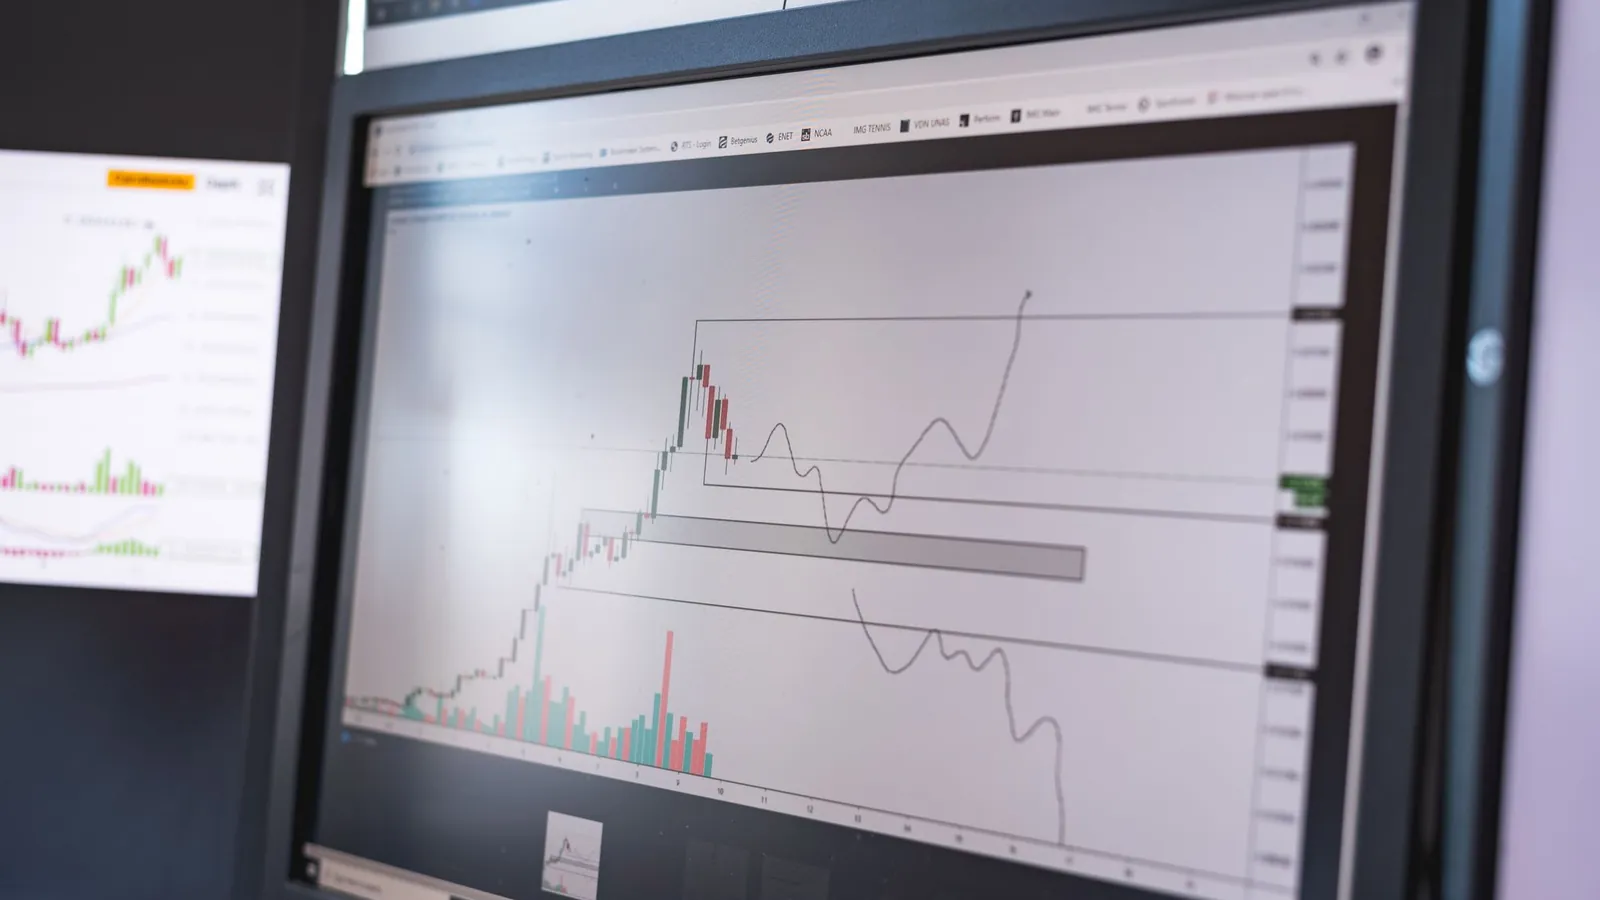
Retail frameworks such as ICT trading and smart money concepts try to map these footprints on a chart, through liquidity sweeps and order blocks.
Putting order flow into practice
Treat order flow as a lens, not a crystal ball: it shows what traded, but the largest flows will always reach the institution first.
To practice reading flows and managing risk around them without risking personal capital, a Velotrade challenge gives you a simulated account with fixed risk rules across crypto, forex, stocks, index ETFs and commodities. This article is educational and not investment advice.
Ready to trade with $200,000 capital?
Explore challengesFrequently Asked Questions
About the author

Vittorio De Angelis
Executive Chairman
Former equity-derivatives trader at JP Morgan, Dresdner Kleinwort and Bank of America in London. Later Head of Brokerage at a global broker in Hong Kong.
View author page