Trade indices with funded capital
ExploreA stock index tracks a basket of companies in one number, so trading an index is a way to take a view on a whole market instead of a single stock. There is more than one way to do it: index CFDs, index futures, and index ETFs each track the same underlying benchmark but differ in cost, leverage, and access. The right one depends on where you trade and how you want your positions structured.
This guide explains what a stock index is, the practical ways to trade one, what actually moves index prices, and how traders access indices through a funded account using liquid US ETFs.
Highlights of this article
- A stock index (S&P 500, Nasdaq-100, Russell 2000) tracks a basket of companies in a single price
- Indices trade three main ways: index CFDs, index futures, and index ETFs
- ETFs like SPY and QQQ track the S&P 500 and Nasdaq-100 and trade on regulated US exchanges
- Index prices move on macro data, rate decisions, and earnings season, not on any one company
- On a Velotrade funded account you trade indices through liquid ETFs (SPY, QQQ, and more) at up to 6x, alongside crypto, forex, commodities, and stocks
What is a stock index?
A stock index measures the combined value of a group of companies. The S&P 500 tracks 500 large US companies, the Nasdaq-100 tracks the 100 largest non-financial companies on the Nasdaq, and the Russell 2000 tracks 2,000 smaller US companies. Instead of picking one stock, you take a position on the whole basket, which is why indices are a core way to trade the broad direction of a market.
You cannot buy an index directly, because it is a calculation, not an asset. What you trade is an instrument that tracks the index: a CFD, a futures contract, or an ETF.
Thinking about using this on a funded account? Before you do, read the best prop firms for index traders, how a static maximum drawdown works and why traders fail prop challenges.
The three ways to trade indices
1. Index CFDs. A contract for difference that tracks an index price (often labelled NAS100, US30, or US500 on some platforms). You go long or short with leverage and never own the underlying shares. CFDs are flexible and widely used outside the US, but they are synthetic instruments priced by the provider rather than traded on a central exchange.
2. Index futures. Exchange-listed contracts such as the E-mini S&P 500 (ES) and E-mini Nasdaq-100 (NQ) on the CME. Futures have deep liquidity, transparent central-exchange pricing, and fixed contract sizes and expiries, which makes fine position sizing harder for smaller accounts and adds rollover management.
3. Index ETFs. Exchange-traded funds that hold the underlying basket and track the index closely: SPY for the S&P 500, QQQ for the Nasdaq-100, IWM for the Russell 2000. ETFs trade on regulated US exchanges with real underlying holdings, deep liquidity, and tight spreads, and they can be traded long or short with leverage on a margin or funded account.
For how position value is calculated across any of these, see notional value explained.
Index options are another route, used mainly to sell premium or to hedge. If you are new to them, start with the difference between a call and a put. Our guide to selling puts and covered calls explains how option selling works and where it goes wrong.
Index CFDs vs index futures vs ETFs
The three routes track the same benchmark, so the difference is structure and cost:
- CFDs are the most flexible for sizing but are synthetic, provider-priced instruments.
- Futures give genuine exchange liquidity and price discovery, but fixed contract units and expiries suit larger, more active accounts.
- ETFs hold the real basket and trade on a regulated exchange, combining exchange transparency with flexible sizing.
A practical point for US-based traders: index CFDs are generally not available through US domestic brokers, so US retail traders typically use ETFs or futures. That makes ETFs the most accessible route to broad-index exposure for many traders.


What moves index prices
An index is a basket, so no single company drives it. What moves indices is macro:
- Interest-rate decisions. FOMC decisions and the rate path move equity indices sharply, because rates change the discount applied to future earnings. See what is FOMC trading.
- Inflation and jobs data. CPI and non-farm payrolls reset expectations for policy and growth. See what is NFP trading.
- Earnings season. When a large share of index constituents report, aggregate results move the whole index, and the Nasdaq-100 is especially sensitive to a handful of mega-cap tech names.
- Risk sentiment. Geopolitical shocks and liquidity conditions drive broad risk-on and risk-off moves across every index at once.
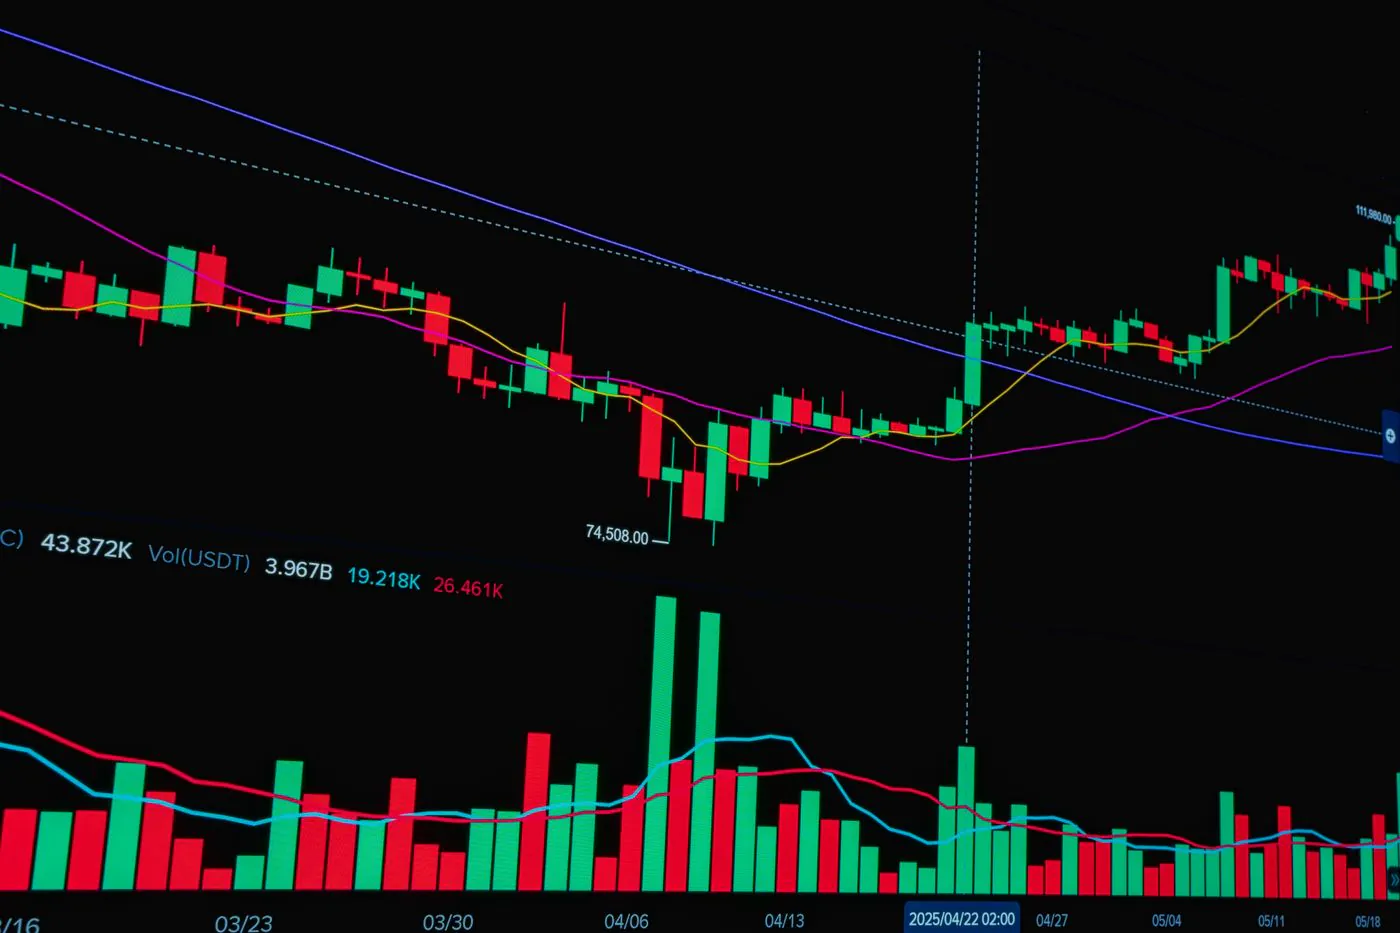
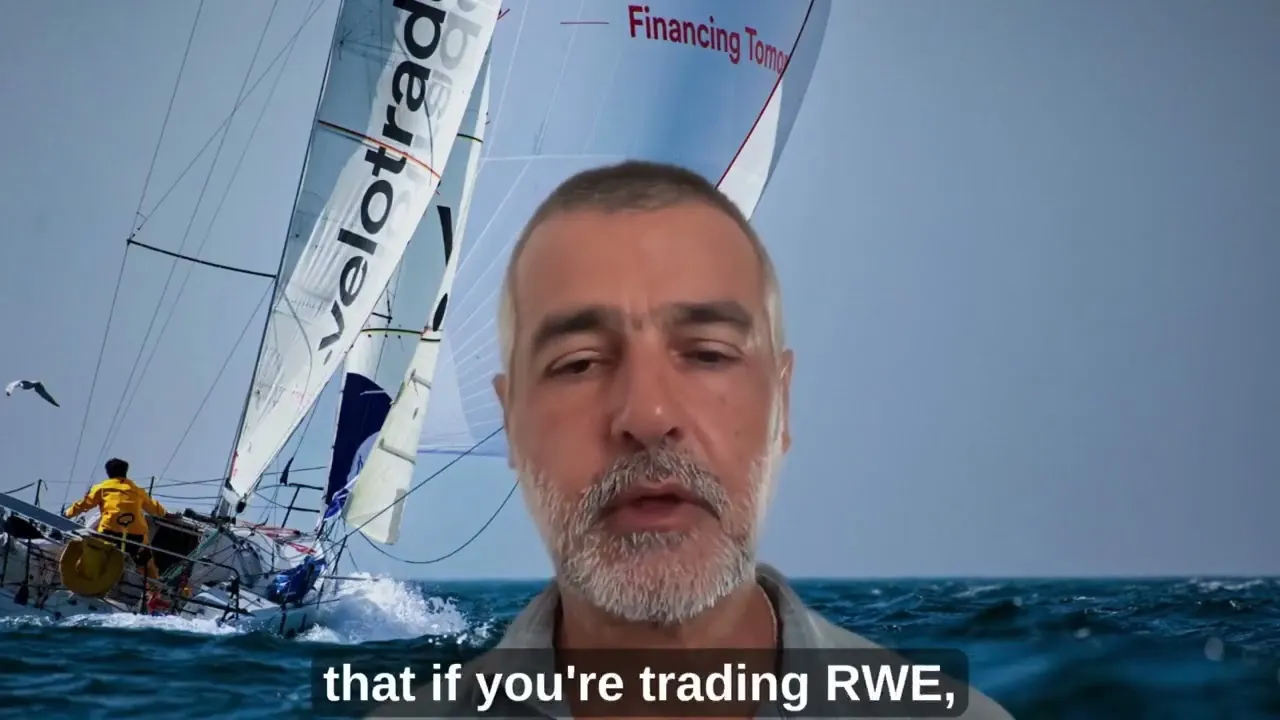
Index prices also move on flows you cannot see on a chart. Vittorio De Angelis, Velotrade's co-founder and a former bank derivatives trader, explains how a single corporate hedge can push a stock around, and how in early 2008 he saw European indices open flat on days when the US was down 1% or 2%, because Société Générale's Jérôme Kerviel was secretly buying index futures:
 5:24
5:24Read the transcript
A couple more stories from the trenches. War stories.
The reason I like sharing these stories is to make all investors aware that sometimes an investor sits in front of his screen, has access to a huge amount of information, is very good at looking at charts, but there are always elements that the investor will never know about, or is unlikely ever to know about. Two examples.
The first: I was trading RWE, which is a German utility company, and we had a corporate trade. We called them corporate trades when they were extremely large and generally initiated by a corporate.
The transaction entailed the client going synthetically long RWE, so the client was buying calls and selling puts. I'm not sure why he needed to do that. Maybe he was not allowed to buy more shares, maybe there was some corporate agreement that prevented him from increasing his exposure to the company further.
Anyway, it took us a couple of days, maybe a week, to price the transaction. It was very large. Eventually the client said done, and of course, as I was buying the puts and selling the calls, I had to go and buy the delta in the market, which was a very large transaction.
Then, once the transaction was booked, I also had to hedge the volatility, because this transaction put me very, very long vega. The strike of the put I was buying was much closer to the money than the call I was selling. And at the time I was not overly bullish on volatility. So I went out and sold two or three million dollars' worth of vega, which is a ton of options.
The reason I'm mentioning this is that if you are trading RWE, you can look at all the charts in the world, but you'll never know when the client says done to the investment bank, and you don't know when the bank is going to go out there and execute the delta.
In this case, I had to buy a very large amount of shares. I was buying puts, so I had to hedge the puts. I was selling calls, so I had to hedge those as well. And obviously the flows I was executing hugely distorted the market, at least in the short term.
I had an added bonus on that transaction, because buying puts and selling calls left me long dividends. As I mentioned previously, because of structured products, dividends were priced very low in the market. So when RWE eventually reported results and gave news on the dividend, I made a lot of P&L.
The second example actually cost me, as a professional, a fair amount of money. I believe it was January 2008. There was a trader at Société Générale, Jérôme Kerviel, who had experience in the back office, which is generally a somewhat dangerous combination.
Because once he came to the front office, he started trading and accumulated a massive rogue position. He was able to hide it because he knew how the back office worked. He knew the weaknesses of the reporting systems.
He built a long futures position on, I believe, the Euro Stoxx, the CAC and a bunch of European indices, of around 50 billion euros. When he was eventually caught, unwinding it cost the bank about 4.9 billion euros.
The reason I'm mentioning it is that I had some danger on the downside, meaning I had some structured products in my books that could be dangerous if the market went down. So I decided to buy options on the Euro Stoxx, to buy some gamma.
As I explained previously, if you are long options, the more the market moves, the more money you make. However, to hold long options you are paying theta. When you buy options you have to pay a premium, and that premium decays over time. It can be a really substantial amount of money.
So what happened there? Because Jérôme Kerviel was buying an enormous amount of futures, the market never actually went down. You had occasions on which the US opened 1% or 2% lower and Europe opened flat. Not because the correlation broke down, but because there was an individual buying a huge amount of futures at that level.
So of course my options never performed. They decayed slowly but surely, and it cost me a lot of money.
And that was as a professional, so I had very good access to information. Imagine if you're a retail trader trading the Euro Stoxx and there is an event like that happening. You're obviously at a disadvantage.
I'm not telling people not to trade. I'm sharing my experiences so that next time you think you know it all, you bear in mind that there is a certain amount of information that is not shared. Speak soon.
Index traders often read the same chart patterns as stock traders: head and shoulders, triangles and flags. Our chart patterns guide covers them all with annotated examples.
Trading indices on a funded account
A funded account lets you trade a firm's capital against a profit split, with your downside limited to a one-time challenge fee. For a full comparison of the model against trading your own money, see funded trading vs leverage trading.
Velotrade offers indices through liquid US ETFs rather than synthetic CFD indices:
- SPY (S&P 500) and QQQ (Nasdaq-100), the two most liquid equity ETFs, plus IWM (Russell 2000) and regional ETFs for Japan, South Korea, Brazil, and Europe.
- Index ETFs trade at up to 6x leverage on the challenge (5x funded), with commission of 0.03% per side and no spread markup.
- They sit on one DXtrade funded account alongside crypto, forex, commodities, and single stocks, so you can rotate between markets without switching firms. See the full instrument list.
- The rules suit an active index strategy: static maximum drawdown (the loss floor is fixed from your starting balance and never trails your equity), no consistency rule, news trading permitted, and positions can be held through the weekend.
Velotrade is unregulated and offers educational, simulated evaluations with real-time market pricing. It is not a broker, dealer, or custodian, and no orders are placed on an exchange.
Index trading basics
- Sessions. US equity indices are most active during US cash-market hours; the open and close carry the heaviest volume and the sharpest moves, and many intraday traders anchor to the VWAP during the cash session. That is why the opening range breakout is one of the most common index day-trading setups.
- Volatility. The Nasdaq-100 is typically more volatile than the S&P 500 because of its tech concentration; the Russell 2000 reacts hardest to growth and rate expectations.
- Sizing. Size positions against your daily loss limit and static drawdown, not against the maximum leverage available. Index moves can be fast around data releases.
- Diversification. Trading an index alongside single stocks, forex, and commodities on one account spreads risk across drivers rather than concentrating it in one name.
To compare firms specifically for index trading, see best prop firm for indices, and for the Nasdaq-100 in detail, see what is NAS100.
Frequently Asked Questions
About the author

Vittorio De Angelis
Executive Chairman
Former equity-derivatives trader at JP Morgan, Dresdner Kleinwort and Bank of America in London. Later Head of Brokerage at a global broker in Hong Kong.
Velotrade was founded in Hong Kong in 2016 by a team from JP Morgan, Dresdner Kleinwort and Bank of America, has paid out over $2.5 billion to its trade-finance clients, and has been featured in Bloomberg, the Financial Times, the Wall Street Journal and on Nasdaq. Its prop trading evaluations are simulated and educational.
View author page