New to funded trading?
ExploreContango is when futures contracts for later delivery trade above the current spot price, so the futures curve slopes upward. Backwardation is the opposite: later contracts trade below spot, so the curve slopes downward. The shape tells you what the market charges to hold an asset over time, and it decides whether rolling a futures position quietly costs you money or pays you.
Both terms apply to any market with dated futures, from crude oil to bitcoin. For the wider product family, see our guide to crypto derivatives.
Quick answer: Contango is a futures market condition in which contracts with later expiry dates are priced above the spot price, usually because of financing and storage costs. Backwardation is the reverse condition, in which later contracts are priced below spot, usually because buyers value holding the physical asset now. Every futures price converges to spot at expiry.
Highlights of this article
- Contango means later futures cost more than spot (upward curve); backwardation means later futures cost less (downward curve)
- The slope comes from the cost of carry: financing plus storage, minus the convenience yield of holding the asset
- Crypto dated futures usually trade at a premium to spot; a 3% premium with 90 days left is roughly 12% annualised
- In contango, long futures funds lose money on each roll even if spot stays flat (negative roll yield)
- Futures and spot converge at expiry; perpetual futures have no expiry and use a funding rate instead
Funded accounts
Ready to get funded?
Trade up to $200,000 in firm capital with static drawdown, no consistency rule, and payouts within 24 hours. Pass the challenge and keep up to 90% of your profits.
Get funded from $40| Item | Detail |
|---|---|
| Definition | Contango: futures above spot. Backwardation: futures below spot. |
| Rule of thumb | Futures ≈ spot + financing + storage, minus convenience yield |
| Annualised basis | (futures / spot, minus 1) x (365 / days to expiry) |
| Worked example | Futures 3% above spot, 90 days left: 3% x 365 / 90 ≈ 12.2% a year |
| When it matters | Rolling futures, holding futures ETFs, cash-and-carry trades, reading sentiment |
| Main risk | Negative roll yield in contango; leverage on the futures leg |
| Related terms | Basis, cost of carry, roll yield, convergence, funding rate |
What is contango?
Contango is a market state in which each futures contract trades at a higher price the further away its expiry date is. With spot at 100, a three-month contract might trade at 101.5 and a twelve-month contract at 106. The futures curve, a line joining the prices of every expiry, slopes upward.
Contango is the normal state for assets that cost money to hold and that nobody urgently needs today, such as gold and, most of the time, bitcoin.
What is backwardation?
Backwardation is a market state in which futures for later delivery trade below the spot price, so the curve slopes downward. With spot at 100, the twelve-month contract might trade at 95.
Backwardation usually signals tight supply right now. When refiners need crude oil this month, they pay up for prompt barrels, and the near contracts rise above the distant ones.
In the chart, spot is fixed at 100 (the dashed line). The contango curve rises to about 106 at twelve months, while the backwardation curve falls to about 95. At zero months to expiry, both curves meet spot: that is convergence.
Why do futures curves slope?
Futures curves slope because of the cost of carry, the net cost of buying an asset today and holding it until expiry. Buying now and holding should cost about the same as buying a futures contract, or arbitrage traders step in.
The cost of carry has three parts:
- Financing. Money tied up in the asset could earn interest elsewhere. Higher interest rates push futures further above spot.
- Storage and insurance. Oil needs tanks, grain needs silos, gold needs vaults. These costs add to the futures price.
- Convenience yield. Holding the physical asset has value when supply is tight (a refinery that runs out of crude stops working). This benefit subtracts from the futures price.
A simple way to write it: futures price ≈ spot x (1 + financing rate + storage cost, minus convenience yield) over the holding period. When financing and storage outweigh convenience yield, the curve is in contango. When convenience yield dominates, the curve flips into backwardation.
Worked example: carry on a commodity
Suppose a commodity trades at 100 spot. Annual financing is 5% and storage is 2% a year, and convenience yield is close to zero.
- Carry for one year: 5% + 2% = 7%
- Fair twelve-month futures price: 100 x 1.07 = 107
If the contract traded at 110 instead, a trader could buy spot at 100, store it, sell the futures at 110 and lock in the gap above carry. That trade, called cash and carry, keeps futures close to fair value. Real prices also reflect positioning, so treat the formula as an anchor, not a forecast.
Contango and backwardation in commodities
Commodities show both shapes most clearly because storage is physical and finite.
Crude oil flips between the two. In a well supplied market, the curve sits in contango because storage costs money. When supply tightens, the front months jump and the curve moves into backwardation.
The April 2020 WTI episode is the extreme case of contango. In April 2020, pandemic lockdowns collapsed demand for fuel while oil kept flowing, and storage near the delivery point in Cushing, Oklahoma, was close to full. On 20 April 2020, the expiring May WTI crude contract on NYMEX settled below zero, at roughly minus 37 dollars a barrel. Holders who could not take delivery had to pay others to take it, while later months still traded at positive prices. When storage becomes unaffordable, the front of the curve can fall almost without limit.
Contango and backwardation in crypto
Crypto dated futures, such as the bitcoin and ether futures listed on regulated venues like CME and on many crypto exchanges, usually trade in contango. Bitcoin has no storage cost, but buyers who want leveraged long exposure are often willing to pay a premium, and borrowing to fund that exposure costs money.
The difference between a futures price and spot is called the basis. Traders compare the basis across expiries by annualising it.
Worked example: annualised basis
Bitcoin spot is 100,000 USD. A futures contract expiring in 90 days trades at 103,000 USD.
- Basis: 103,000 minus 100,000 = 3,000 USD, or 3% of spot.
- Periods per year: 365 / 90 ≈ 4.06.
- Annualised basis: 3% x 4.06 ≈ 12.2%, or about 12% a year.
Buying spot and selling that contract locks in roughly 3% over 90 days if both legs are held to expiry, before fees. A higher annualised basis usually means leveraged longs are crowded. Backwardation in crypto is rarer and tends to appear after sharp sell offs.
For a side by side of the two instruments, see crypto futures vs spot.
Payout proof
Fast, real payouts. Traceable on Arbitrum.
- Paid within 24 hours of approval
- Settled on Arbitrum in USDC or USDT
- Look up any transaction on Arbiscan


VIX futures: contango as the default
VIX futures, which track expectations for the CBOE Volatility Index, usually sit in contango in calm markets because traders expect volatility to drift back up from low levels. During market stress the curve often flips into backwardation, because near term fear spikes above longer term expectations.
What is roll yield, and why does contango hurt long futures ETFs?
Roll yield is the gain or loss from closing an expiring futures contract and opening the next one. In contango, roll yield is negative for a long position: you sell the cheaper expiring contract and buy the more expensive next one.
Worked example: a flat market in contango
A fund holds a front month oil contract at 100. The next month trades at 102. Spot does not move for a year.
- At each roll, the fund sells at about 100 and buys at about 102, paying a 2% premium.
- As the new contract approaches expiry, it converges back toward 100.
- Over twelve rolls, the fund loses roughly 2% a month even though oil never moved.
This is why long only funds that roll futures can lag spot badly in persistent contango. In backwardation the effect reverses: the fund sells the expensive expiring contract and buys a cheaper one, earning positive roll yield.
What happens at expiry? Convergence
Convergence is the process by which a futures price moves toward the spot price as expiry approaches, and equals spot (or the final settlement price) at expiry. The basis shrinks to zero because, on the last day, a futures contract is simply a contract for the asset now. In contango, the futures price therefore tends to drift down toward spot over the life of the contract, which is what the chart above shows at zero months.
How do perpetual futures fit in?
Perpetual futures have no expiry, so they cannot converge to spot on a fixed date. Instead, exchanges use a funding rate, a periodic payment between longs and shorts, commonly every 8 hours, with intervals and caps that vary by exchange. When the perpetual trades above the spot index, funding is usually positive and longs pay shorts; when it trades below, shorts usually pay longs.
Positive funding is the perpetual equivalent of contango: longs pay to hold exposure. Negative funding mirrors backwardation. The perpetual swap was launched by BitMEX in 2016 and is now one of the most widely used crypto derivatives. Read more in our perpetual futures guide.
Leverage on the futures leg
Most futures trades are leveraged, and leverage changes the risk far more than the basis does.
The chart compares 1,000 USD held in spot with a 5x futures position backed by the same 1,000 USD of margin. Spot gains or loses 10 USD per 1% move. The 5x futures position gains or loses 50 USD per 1% move, so a 20% fall wipes out the full 1,000 USD margin. Read what liquidation in trading means before using leverage on any futures position.
A founder who traded the futures pits
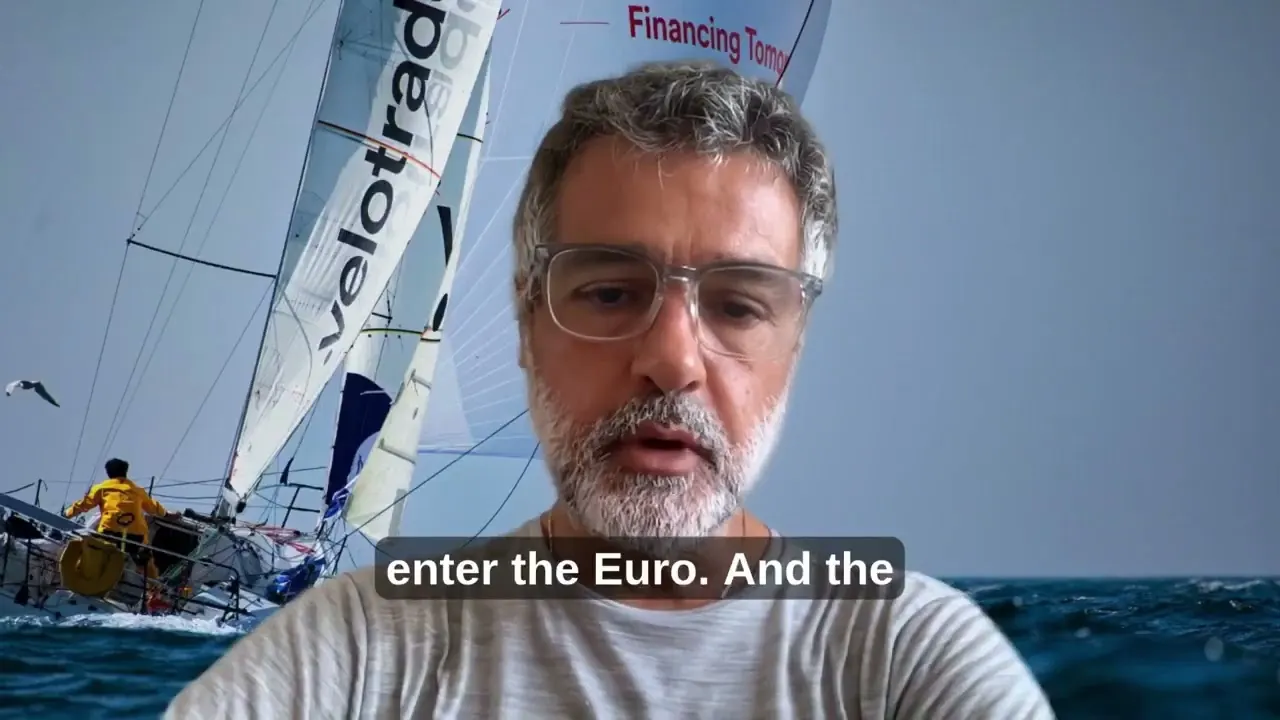
Vittorio De Angelis, Velotrade's co-founder, started his career on a futures and options desk in London, when bond futures traded in open outcry pits on LIFFE. He describes the pits as "a sight to be seen" and recalls an evening when BTP futures surged after hours, calling it "history happening in real time."
 5:00
5:00Read the transcript
Today we go back many, many years. In my first job in investment banking, I was sitting on the futures and options desk of JP Morgan in London.
The desk was on the trading floor of JP Morgan, and we were executing futures and options mainly on fixed income instruments. We were trading futures on the Bund, the Gilt, the BTP and so on, and the shorter end as well: the Euromark, the Eurolira, short sterling.
All the action took place on LIFFE, which was somewhere in the City, and it was a sight to be seen. You had all these pits, one per product, and in each pit you had dozens of traders shouting prices. Price formation and trading happened in real time in the pit.
Large clients, fast clients, prop desks, hedge funds and so on would have a direct line to the execution desk on the floor. The execution desk would receive the order from the client and shout it to the trader in the pit, and the trader would trade on behalf of the client.
In the pit there were also market makers and brokers. When fast markets happened, especially when non-farm payrolls were published, the speed and the volumes trading in those pits were such that sometimes it would take hours to reconcile the trades, because prices and trades were happening so fast.
Anyway, I was sitting on the floor at JP Morgan, and the somewhat slower-paced investors would come to us. Most of my clients were fund managers of large funds who would come to the sales desk because they wanted colour on the market. They wanted economic information, they wanted to know more or less what was going on.
When they decided to execute, they would give me an order, and I would pass it on to the execution team on the JP Morgan trading desk. They had a direct line, always open, to the LIFFE floor. They would transfer the order down to the floor, and the floor would communicate it to the JP Morgan trader in the pit.
We would get the transaction done, they would communicate back that it was executed, and I would report the fill to the client. It was somewhat convoluted compared to today's digital trading, but it was incredibly efficient.
The LIFFE floor was open from the morning until early afternoon. But even back then, after a certain time the floor would close and trading would take place on screen, so it was actually digital trading. Then, of course, at some point the floor was discontinued and 100% of the trading became digital.
But in those days the bulk was traded on the floor, and a little was traded after hours, so to speak, through the screens. Most afternoons and evenings, when the floor shut down, nothing much happened.
But I'll never forget it. Prime Minister Prodi made a statement saying that Italy had met the financial criteria to enter the euro, and the BTP, which is a future on the Italian government bond, shot up.
It was a massive move, and suddenly all the phones went crazy as clients were calling in to buy thousands of lots of BTPs. The volumes were scary, and the price move was exacerbated by the fact that it was not happening on the floor. It was happening after hours, when many traders were not even there.
The future was going up because the price of the bonds was going up. Italy entering the euro meant that the rates on Italian debt would crumble, and so the price of the bonds shot to the sky. We had the JP Morgan prop desk coming in and buying thousands of lots, and the big fund managers coming in to buy huge amounts of BTPs.
By the end of the session the BTP had moved so much. I was a junior salesperson, and I remember calling one very large fund manager who hadn't participated in the buying frenzy. The price had moved so much that, knowing him, I thought maybe he would see it as an overdone move and sell. Obviously, for me, the more commissions I generated and the more trading, the better.
So I called him up, and he looked at the screen, and I'll never forget what he said to me: "We are never going to see rates this high ever again. Buy a few thousand BTP futures."
That was history happening in real time.

How to read a futures curve: a five step routine
- Check spot. Note the current spot or index price.
- List the expiries. Note the front month and two or three later contracts.
- Classify the shape. Rising with time is contango; falling is backwardation. Mixed curves are common.
- Annualise the basis so expiries can be compared.
- Ask what is driving it: rates, storage, supply or crowded positioning. A steep curve is information, not a trade signal.
Common mistakes
- Ignoring roll cost in futures ETFs. A fund can lose money while the spot price is flat.
- Forgetting leverage. Basis trades look low risk on paper, but a leveraged leg can be closed out on a sharp move.
Broker disclosures and academic studies consistently find that most retail day traders lose money, and leverage makes losses arrive faster. Size positions with a clear plan from risk management in trading.
Contango, backwardation and prop trading
Velotrade, a multi-asset prop trading firm, offers simulated evaluation accounts on crypto, forex, stocks, index ETFs and commodities. Velotrade does not charge a variable funding rate. Crypto, index, commodity and single stock positions still open at 00:30 UTC pay a flat overnight rate of 0.05% of notional, charged every day including weekends, the same whether you are long or short. Commission on crypto is 0.03% per side.
Curve shape does not change your holding cost on Velotrade, but public futures curves still show how crowded a trade is. The risk limits that do apply are the daily loss limit, which resets at 00:30 UTC and is set from the higher of your balance or equity (5% on CLASSIC 2-Step, 4% on CLASSIC 1-Step, 3% on PRO 1-Step), and a static maximum drawdown. Leverage limits are on the instruments page, and challenge options are on the challenges page.
Can AI help with futures curve analysis?
AI tools can help collect prices across expiries, annualise the basis and flag when a curve changes shape. They can also review a trading journal for patterns, such as losses around roll dates. See our guides to AI trading strategies and backtesting trading strategies.
AI does not remove risk. A curve can hold one shape far longer than a model expects, and human judgement still decides position size.
Frequently Asked Questions
About the author

Vittorio De Angelis
Executive Chairman
Former equity-derivatives trader at JP Morgan, Dresdner Kleinwort and Bank of America in London. Later Head of Brokerage at a global broker in Hong Kong.
View author page