
See exactly how much room your account gives you
ExploreRisk management in trading is the set of rules that decides how much you can lose on each trade, each day and over the life of an account, before you ever think about how much you might make. It covers risk per trade, position sizing, stop placement, reward-to-risk, loss caps, correlation and leverage. Good entries help, but risk rules are what keep a trader solvent long enough for any edge to show up.
Quick answer: Risk management in trading means limiting the loss on every trade to a small, fixed share of the account (often 0.5% to 1%), sizing each position from the distance to a stop-loss, capping losses per day and in total, and avoiding correlated or over-leveraged exposure, so that a normal losing streak never ends the account.
Highlights of this article
- Risk per trade is the foundation: most professional guidance keeps it between 0.5% and 2% of the account, with 1% as a common default
- Position size comes from a formula, not a feeling: account risk in dollars divided by the distance to your stop (the position size calculator does the maths)
- Losses and recoveries are not symmetric: a 50% loss needs a 100% gain to get back to breakeven
- Reward-to-risk and win rate work together: at 1:2 you only need to win about one trade in three to break even, before costs
- Daily loss caps, a hard maximum drawdown and a check on correlated positions stop one bad day from becoming a blown account
- Leverage does not change your risk if you size from the stop, but it makes oversizing very easy
Free calculator
How many losing trades before you breach?
See your drawdown floor, daily loss budget, and losing trade capacity for any account size - before you place a single trade.
Use the free drawdown calculator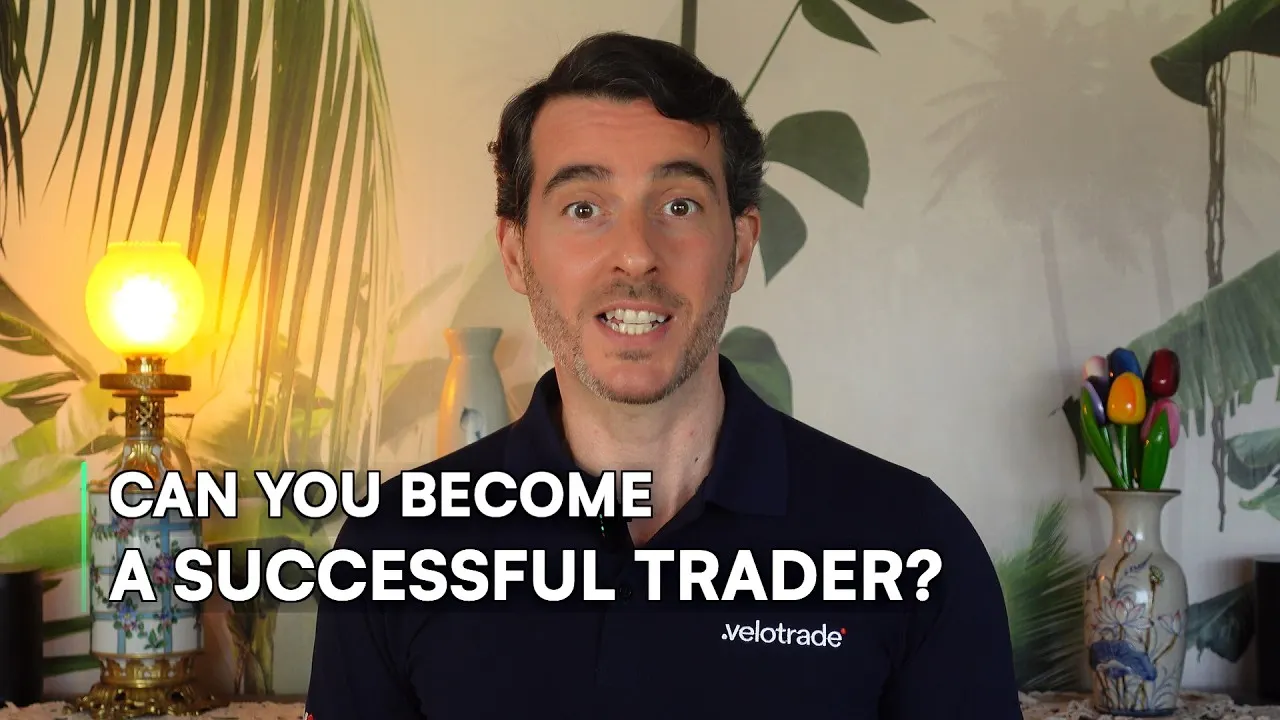 3:14
3:14Read the transcript
Can you become a successful trader? The short answer is yes. The longer answer depends on one question: what does success actually mean to you?
I am Gianluca Pizzituti, CEO of Velotrade. I've been trading for over 25 years, and during that time I have met many successful traders who could not have been more different from one another.
When I was working at a bank in London, there was a trader who was famous for being one of the most volatile performers in the City. In one year, he reportedly made around 25 million dollars. In another year, he lost around 10 million dollars.
If you were his manager, you knew exactly why you hired him. You wanted the possibility of that extraordinary year. But to get that possibility, you also had to accept the volatility that came with it.
I spoke with him a few times, and it became very clear that his way of thinking was completely different from mine. My approach was more conservative. If I reached a level of profit that satisfied me, I was comfortable protecting it.
I wanted to build wealth steadily. I did not need every good month to become an extraordinary month. He was different. When he reached a strong P&L, he did not slow down. He pressed the advantage.
His thinking was: what could go wrong? Worst case, I lose the profit I made this month, or the profit I made this quarter. Best case, I turn a good period into an exceptional one.
That requires a very particular mindset. Some people are genuinely wired that way. Most people are not.
And let me be clear, I am not talking about taking random risks. He had the experience, a mandate and a defined approach. This was not a beginner doubling his position because he felt lucky.
The lesson is not that you should copy him. The lesson is that success must match your temperament, your capital, your objectives and your tolerance for loss. If your strategy keeps you awake at night, it is not the right strategy for you, regardless of how impressive somebody else's results look.
For one person, success means producing a consistent second income with controlled risk. For another, it means pursuing exceptional returns and accepting substantial volatility. Neither definition is automatically right or wrong.
The mistake is borrowing somebody else's definition and pretending it belongs to you. You do not need the biggest P&L in the room. You need an approach you can tolerate, repeat and sustain.
So, which one are you? Are you the steady builder, or are you prepared to accept more volatility for the possibility of an exceptional result? Drop it in the comments.
In this video, Gianluca Pizzituti, Velotrade's co-founder, explains why the right level of risk depends on the trader, not on someone else's results. His test is simple: "If your strategy keeps you awake at night, it is not the right strategy for you." The rules below are the practical version of that idea.
What is risk management in trading?
Risk management in trading is the process of deciding, in advance, the maximum amount you are willing to lose on a trade, in a day and in total, and then sizing and managing positions so those limits hold. It is a plan made before the order goes in, not a reaction after the price has moved.
The reason it matters is uncomfortable but well documented. Broker disclosures and academic studies consistently find that most retail day traders lose money. Many of those losses come not from a bad strategy alone but from oversized trades, revenge trading or several positions that were secretly the same bet. Risk management is the layer that limits the damage from all three.
The 7 core risk rules at a glance
| Item | Detail |
|---|---|
| Rule 1: Risk per trade | Risk a fixed 0.5% to 1% of the account per trade (fixed fractional sizing) |
| Rule 2: Position sizing | Position size = account risk in dollars / (entry price minus stop price). Use the position size calculator |
| Rule 3: Stop placement | Put the stop-loss where the trade idea is proven wrong, then size to it. Never move it further away |
| Rule 4: Reward-to-risk | Know your reward-to-risk ratio and the win rate it needs before entering |
| Rule 5: Daily loss cap | Stop trading for the day after a set loss (for example 2% or three losing trades) |
| Rule 6: Maximum drawdown | Set a hard floor for the account. In a prop evaluation this is the static maximum drawdown |
| Rule 7: Exposure and leverage | Count correlated positions as one bet and treat leverage as a ceiling, not a target |
Rule 1: How much should you risk per trade?
Most traders should risk between 0.5% and 1% of their account on a single trade, and rarely more than 2%. This is often called the 1% rule: on a $10,000 account, the most you lose if the stop is hit is $100.
The method behind it is called fixed fractional sizing. Instead of risking a fixed dollar amount forever, you risk a fixed fraction of the current balance. As the account grows, the dollar risk grows with it. As the account shrinks, the dollar risk shrinks too, which slows the damage during a bad run.
The chart shows how many losing trades in a row it takes to lose 10% of an account. At 0.5% risk per trade it takes 22 consecutive losses. At 1% it takes 11. At 2% it takes 6, and at 5% just 3. A run of five or six losses is ordinary for most strategies, so at 5% risk an ordinary bad week can cost a large slice of the account.
Is the 1% rule too conservative?
The 1% rule is not too conservative for most traders, because it is designed to survive the streaks every strategy eventually produces. Experienced traders with a long, measured record sometimes go higher. Formulas such as the Kelly criterion can estimate an upper bound for risk per trade, but most practitioners use a fraction of it because the inputs are uncertain.
Rule 2: How do you calculate position size?
Position size is calculated by dividing the amount you are willing to lose by the distance between your entry and your stop. The formula is:
Position size = (Account balance x Risk %) / (Entry price minus Stop price)
Worked example: a stock trade
- Account balance: $10,000. Risk per trade: 1%. Dollar risk: $10,000 x 0.01 = $100.
- Planned entry: $50.00. Stop-loss: $48.00. Risk per share: $50.00 minus $48.00 = $2.00.
- Position size: $100 / $2.00 = 50 shares.
- Position value: 50 x $50.00 = $2,500.
If the stop is hit, the loss is 50 x $2.00 = $100, which is exactly 1% of the account (before commission and any slippage).
Worked example: a forex trade
- Account balance: $10,000. Risk: 1%, so $100.
- EURUSD stop distance: 25 pips. On a standard lot of a USD-quoted pair, one pip is worth $10.
- Risk per standard lot: 25 x $10 = $250.
- Position size: $100 / $250 = 0.4 lots.
In both examples the stop came first and the size came from the stop, so the dollar risk stays at $100 whatever the stop distance. The free position size calculator runs this for any instrument so you do not have to do it by hand under pressure.
Rule 3: Where should you place your stop-loss?
Place the stop-loss at the price where your trade idea is clearly wrong, not at the price that gives you the position size you wanted. A long trade bought on a bounce from support is invalidated if price closes below that support, so the stop belongs a little beyond it.
Practical guidelines:
- Use structure. Swing lows, swing highs and support or resistance levels are natural invalidation points.
- Respect volatility. A stop inside normal price noise gets hit for no reason. The ATR indicator measures average range and helps set a stop outside that noise.
- Know your order type. A stop-market order exits at the next available price and can fill worse than the stop in a fast market. A stop-limit order controls the price but may not fill at all (Velotrade has disabled stop-limit orders, so its stop losses exit at market). The order types guide compares them.
- Never widen a stop after entry. Moving a stop further away to avoid a loss turns a planned 1% risk into an unknown one.
Payout proof
Fast, real payouts. Traceable on Arbitrum.
- Paid within 24 hours of approval
- Settled on Arbitrum in USDC or USDT
- Look up any transaction on Arbiscan


Rule 4: How do reward-to-risk and win rate work together?
Reward-to-risk compares what a trade can make with what it can lose, and it determines the minimum win rate you need to break even. A trade risking $100 to make $200 has a reward-to-risk of 1:2.
The chart shows the break-even win rate at each ratio, before fees and spreads, using the formula break-even win rate = 1 / (1 + reward-to-risk). At 1:1 you need to win 50% of trades. At 1:2 you need 33.3%. At 1:3 you need 25%, and at 1:4 just 20%.
You can combine the two numbers into expectancy, the average result per trade measured in R (one R is the amount risked):
Expectancy = (Win rate x Average win in R) minus (Loss rate x Average loss in R)
Example: a strategy wins 40% of the time with an average win of 2R and an average loss of 1R. Expectancy = (0.40 x 2) minus (0.60 x 1) = 0.80 minus 0.60 = +0.20R per trade, before costs. Risking $100 per trade, that is an average of $20 per trade over a large sample.
A high ratio usually comes with a lower win rate, and spreads, commission and slippage shrink every winner and enlarge every loser. The risk-reward ratio guide goes deeper on setting realistic targets.
Rule 5: Why do you need a daily loss cap?
A daily loss cap stops you trading for the rest of the day once losses reach a set level, because the worst decisions usually follow a run of losses. Revenge trading, doubling up to "win it back" and abandoning the plan all happen most often on red days.

Common personal caps include:
- A percentage cap, such as 2% of the account in one day.
- A trade-count cap, such as stopping after three losing trades in a row.
- A behaviour cap, such as stopping after any trade taken outside the plan.
The trading psychology guide covers why the urge to keep trading after losses is so strong.
Rule 6: What is a maximum drawdown and why does it matter?
Maximum drawdown is the largest fall from a peak (or, in a static model, from the starting balance) that an account is allowed to suffer before trading stops. It is the line that protects the whole account, rather than a single trade or a single day.
The reason to set it is the maths of recovery.
The chart shows the gain needed to get back to breakeven after each loss. A 10% loss needs an 11.1% gain. A 20% loss needs 25%. A 30% loss needs 42.9%, a 40% loss needs 66.7%, and a 50% loss needs a 100% gain. After a 75% loss, the account has to grow 300% just to return to where it started.
The arithmetic: if $10,000 falls 50% to $5,000, getting back to $10,000 means adding $5,000 to $5,000, which is a 100% gain. This single chart is the strongest argument for every other rule in this article.
To see how much room a given drawdown limit leaves at your risk per trade, try the prop trading drawdown calculator.
Rule 7: How do correlation and leverage create hidden risk?
Correlation and leverage both increase risk without changing how a single trade looks on screen, which is why they catch traders out.
Correlation and overexposure
Correlated positions are positions that tend to move together, so holding several of them is closer to one large bet than several small ones. Examples:
- Long BTC, long ETH and long SOL at 1% risk each is close to a single 3% bet on crypto direction.
- Long EURUSD and short USDCHF are both, largely, a bet against the US dollar.
- Long SPY and long QQQ are both bets on US equities rising.
A simple rule: decide on a maximum combined risk for any one theme (for example 2%), and count correlated trades towards that total.
Leverage
Leverage lets you control a position larger than your account. Used with proper sizing, leverage does not change your risk, because the stop and the position size still cap the loss. Used without sizing, it magnifies every move.
Example: with $10,000 and 5x leverage, you can open a $50,000 position. A 2% move against that position costs $1,000, which is 10% of the account. If the same trade were sized from a stop at 1% risk, the loss would be $100 regardless of the leverage available.
On a leveraged broker account, a large adverse move can also trigger a margin call or forced liquidation. The guides to liquidation and prop firm leverage explain how leverage limits work in practice. Strategies with open-ended risk, such as short selling during a short squeeze, need extra care because the loss on a short has no natural ceiling.
How do you survive a losing streak?
You survive a losing streak by keeping risk per trade small enough that the streak is a dent rather than a crash, and by reducing size when the account is in drawdown. Every strategy has losing runs, including profitable ones.
A practical routine:
- Cut risk after a set drawdown. For example, halve risk per trade from 1% to 0.5% once the account is 5% below its peak.
- Take a pause. After hitting the daily cap twice in a week, stop and review rather than trade.
- Review the journal, not the P&L. A trading journal shows whether losses came from following the plan (normal variance) or breaking it (a discipline problem).
Gianluca Pizzituti's point in the video applies here: the goal is not the biggest result in the room. As he puts it, "You need an approach you can tolerate, repeat and sustain."
A pre-trade risk checklist
Run through this list before every order. If any answer is unclear, the trade waits.
- Invalidation: Where is the trade idea proven wrong, and is the stop there?
- Dollar risk: What is 0.5% to 1% of the current balance?
- Position size: Dollar risk divided by stop distance. Has it been calculated, not guessed?
- Reward-to-risk: Is the target realistic, and does the ratio fit the strategy's win rate?
- Costs: Have spread, commission and possible slippage been considered?
- Daily cap: How much of today's loss allowance is left?
- Drawdown: How far is the account from its maximum drawdown floor?
- Correlation: Does this trade add to an existing theme, and what is the combined risk?
- Leverage: Is the position size driven by the stop, not by the maximum leverage available?
- Order type: Is the entry a limit or market order, and why? The market vs limit order guide explains the trade-off.
How does risk management apply in a simulated prop evaluation?
In a simulated prop evaluation, the risk rules are written into the account, so poor risk management ends the evaluation rather than just shrinking the balance. Velotrade, a multi-asset prop trading firm, runs simulated evaluations with two hard limits: a daily loss limit and a static maximum drawdown. Position size is limited only by the leverage available for each instrument, there is no cap on risk per trade, and stop-losses are not required. That freedom means the trader's own risk rules matter even more.
The daily loss limit resets every day at 00:30 UTC and is set from the higher of balance or equity at that time:
| Plan | Daily loss limit | Static maximum drawdown |
|---|---|---|
| CLASSIC 2-Step | 5% | 10% |
| CLASSIC 1-Step | 4% | 7% |
| PRO 1-Step | 3% | 3% |
Apply the rules above to those numbers. On a CLASSIC 2-Step $100,000 account, the daily loss limit at the start is $5,000 and the static drawdown floor is $90,000. Risking 1% ($1,000) per trade, five consecutive losses in one day would reach the daily limit. Risking 0.5% ($500), it would take ten.
On a PRO 1-Step $100,000 account, the maximum drawdown is 3%, or $3,000 in total. At 1% risk per trade, three straight losses would use the whole allowance. That is why many traders on tight-drawdown plans risk well under 1% per trade, and why the static maximum drawdown guide is worth reading before choosing a plan.
There is no time limit on the evaluation, although each phase has a minimum trading period. With no deadline, there is no reason to raise risk to hit the target faster. Velotrade accounts are simulated, and nothing here is investment advice.
Can AI help with risk management in trading?
AI can help with parts of risk management, such as scanning a trading journal for patterns, flagging when several open positions are correlated, or running large numbers of tests during backtesting.
AI does not remove risk. A model trained on past data can be confidently wrong when market conditions change, and it cannot decide what level of loss you can tolerate. Treat it as an assistant for analysis, with human judgement making the final call. The guide to AI trading strategies covers the strengths and limits in more detail.
Frequently Asked Questions
About the author

Gianluca Pizzituti
Chief Executive Officer
Formerly on the derivatives desk at Dresdner Kleinwort in London, then founded and ran a proprietary HFT firm in FX and equity indices out of Singapore.
View author page