
Size every trade from your risk and stop
ExploreThe Kelly criterion is a formula that tells you what fraction of your capital to risk on each bet or trade so that your money grows as fast as possible over the long run. It needs only two inputs: how often you win and how big your wins are compared with your losses. In real trading the full Kelly fraction is almost always too aggressive, which is why most professionals use a fraction of it or a small fixed percentage instead.
This guide covers where the formula came from, how to calculate it, what the growth curve shows, and how it fits inside a prop firm evaluation. It is part of our wider guide to risk management in trading.
Quick answer: The Kelly criterion is a position sizing formula, f* = p minus q divided by b, where p is the win probability, q is the loss probability and b is the payoff ratio. The result is the fraction of capital that maximises long-run growth. Traders usually risk half Kelly or less because win rates and payoffs are estimates.
Highlights of this article
- The Kelly criterion was published by John L. Kelly Jr. at Bell Labs in 1956 and later applied to blackjack and investing by Edward Thorp
- The formula is f* = p minus q/b: a 55% win rate at 1:1 payoff gives 10%, and a 40% win rate at 2:1 payoff also gives 10%
- Betting twice the Kelly fraction produces roughly zero long-run growth, even with a real edge
- Half Kelly keeps about three quarters of the growth with far smaller swings
- Inside a prop evaluation with a daily loss limit and a static maximum drawdown, full Kelly sizes are usually far too large
Free calculator
Size your position before you trade
Enter your balance, risk, entry and Stop Loss. Get the position size, notional value and leverage you need before you place a trade.
Open the Position Size CalculatorWhat is the Kelly criterion?
The Kelly criterion is a rule for sizing repeated bets so that the expected logarithmic growth of capital is as high as possible. In plain terms, it finds the bet size that makes an account compound fastest over many trades.
Bet too small and you leave growth on the table. Bet too large and losses compound faster than wins, so even a winning strategy shrinks. The Kelly fraction sits between those two failures.
| Item | Detail |
|---|---|
| Definition | The fraction of capital to risk per bet that maximises long-run compound growth |
| Formula | f* = p minus q/b (p = win probability, q = 1 minus p, b = average win divided by average loss) |
| Worked example | 55% win rate, 1:1 payoff: 0.55 minus 0.45/1 = 0.10, so risk 10% of capital |
| When it matters | Any repeated strategy with a measurable edge and a fairly stable payoff |
| Main risk | Overestimating your edge, which turns Kelly sizing into over-betting |
| Related terms | Risk-reward ratio, fractional Kelly, risk of ruin, position sizing |
Where did the Kelly criterion come from?
The Kelly criterion came from information theory, not finance. John L. Kelly Jr., a researcher at Bell Labs, published it in 1956 in a paper titled "A New Interpretation of Information Rate". He showed how a gambler with a noisy private tip should size bets to grow fastest.
Edward Thorp, a mathematician, took the formula to the casino. He used it to size blackjack bets in his 1962 book "Beat the Dealer", then applied the same thinking to investing.
How do you calculate the Kelly criterion?
You calculate the Kelly criterion by putting your win probability and payoff ratio into f* = p minus q/b. The result is the fraction of capital to put at risk on each trade.
- Estimate p, your win probability, from a large sample of real or backtested trades.
- Calculate q, your loss probability: q = 1 minus p.
- Calculate b, your payoff ratio: average winning trade divided by average losing trade.
- Apply the formula: f* = p minus (q divided by b).
- Interpret the answer. A positive result is the fraction to risk. Zero or a negative result means the strategy has no edge.
In trading, "risk" means the amount you lose if your stop-loss is hit, not the size of the position. A Kelly fraction of 10% means the stop distance multiplied by position size should equal 10% of the account.
Worked example 1: 55% win rate, 1:1 payoff
A strategy wins 55% of the time and its average win equals its average loss.
- p = 0.55, q = 1 minus 0.55 = 0.45, b = 1
- f* = 0.55 minus (0.45 / 1) = 0.55 minus 0.45 = 0.10, or 10% of capital
On a 10,000 USD account, full Kelly says risk 1,000 USD per trade.
Worked example 2: 40% win rate, 2:1 payoff
A trend-following strategy wins only 40% of the time, but its average win is twice its average loss.
- p = 0.40, q = 1 minus 0.40 = 0.60, b = 2
- f* = 0.40 minus (0.60 / 2) = 0.40 minus 0.30 = 0.10, or 10% of capital
Two very different strategies produce the same Kelly fraction. A low win rate is fine if the payoff is large enough, the same logic behind breakeven win rates in the risk-reward ratio. If a strategy wins 45% at 1:1, the result is 0.45 minus 0.55 = minus 0.10: negative expected value, and no position size can fix it.
Payout proof
Fast, real payouts. Traceable on Arbitrum.
- Paid within 24 hours of approval
- Settled on Arbitrum in USDC or USDT
- Look up any transaction on Arbiscan


What does the Kelly growth curve show?
The Kelly growth curve shows how long-run growth changes as you bet a larger fraction of capital. Growth rises with bet size, peaks at the Kelly fraction, then falls and eventually turns negative.
The chart uses the first worked example, a 55% win rate at even payoff, so full Kelly is 10% of capital:
- Full Kelly (10%) is the top of the curve, at roughly 0.5% expected growth per bet.
- Half Kelly (5%) keeps about three quarters of that growth while risking half as much per trade.
- Twice Kelly (20%) produces roughly zero growth. The strategy still wins 55% of the time, yet over many bets the account goes nowhere, and anything larger shrinks it.
The curve is flat near the top and steep on the right: betting a little under Kelly costs little growth, betting over it costs a lot.
Why do traders use fractional Kelly?
Traders use fractional Kelly because it gives up a little growth for a large reduction in volatility and drawdowns. Fractional Kelly means risking a set share of the full Kelly amount, typically one half or one quarter.
Under idealised textbook assumptions, a full-Kelly bettor has about a 50% chance of seeing the account fall to half its peak at some point, while at half Kelly that chance drops to about 12.5%. Real markets are messier than the model.
Fractional Kelly is also a buffer: if your true edge is smaller than you thought, half Kelly still sits near the top of the curve.

Is the Kelly criterion too aggressive for trading?
Yes, full Kelly is usually too aggressive for trading, because the formula assumes you know your edge exactly and that losses are capped where you planned. Neither is reliably true in markets.
Estimation error
Your win rate and payoff ratio are estimates from a limited sample, and they drift as conditions change. Suppose you measure a 55% win rate at 1:1 and size at 10%, but your true win rate is 52%. The true Kelly fraction is 0.52 minus 0.48 = 4%. You are now betting 2.5 times the real Kelly amount, beyond the zero-growth point on the curve. The strategy has an edge and still loses money because of sizing alone.
Costs make this worse. Spreads, commissions and slippage shrink the average win and enlarge the average loss, which lowers b and the true Kelly fraction. A trading journal that records actual fills gives far more honest inputs.
Fat tails and gaps
Market returns have fat tails: extreme moves happen more often than simple models expect. Prices can also gap through a stop, turning a planned 1R loss into 2R or 3R. When that happens, real risk per trade is larger than the number you plugged in. Combined with leverage in a live brokerage account, over-sizing is also how traders end up facing a margin call.
Drawdowns and psychology
Even with correct inputs, full Kelly produces deep drawdowns. Few traders can stick to a plan through a 40% or 50% fall, and abandoning a strategy at the bottom locks in the loss. Trading psychology is part of sizing: the right size is one you can follow through a bad streak.
Broker disclosures and academic studies consistently find that most retail day traders lose money. Kelly can only size an edge that exists. It cannot create one.
Kelly criterion vs fixed 1% risk per trade
Fixed fractional sizing, such as risking 1% of the account per trade, is the simpler and more common alternative. Its main strength is that it does not need a precise estimate of your edge.
| Factor | Full Kelly | Half Kelly | Fixed 1% risk |
|---|---|---|---|
| Inputs needed | Accurate win rate and payoff | Accurate win rate and payoff | A stop-loss |
| Risk per trade (55%, 1:1) | 10% | 5% | 1% |
| Growth if edge is right | Maximum | About 75% of maximum | Lower, but steady |
| Damage if edge is overestimated | Severe | Moderate | Small |
| Drawdowns | Very deep | Noticeable | Shallow |
The chart below shows how many losing trades in a row it takes to lose 10% of an account at different risk levels.
At 1% risk, it takes 11 straight losses to lose 10%. At 5% risk, which is half Kelly in the first example, it takes only 3. Losing streaks are normal for most strategies, so a Kelly-style size turns ordinary bad luck into a serious drawdown. Many traders treat Kelly as an upper bound and size at 0.5% to 2% in practice. The position size calculator converts any risk percentage and stop distance into a position size.
How does the Kelly criterion work inside a prop firm evaluation?
Inside a prop firm evaluation, the Kelly criterion is mostly a warning: full and even half Kelly fractions are usually far larger than the account's hard limits allow.
At Velotrade, a multi-asset prop trading firm offering simulated evaluations, the hard limits are a daily loss limit and a static maximum drawdown. There is no cap on risk per trade, and position size is limited only by the leverage available per instrument, so sizing discipline is the trader's job.
| Challenge | Daily loss limit | Static maximum drawdown |
|---|---|---|
| CLASSIC 2-Step | 5% | 10% |
| CLASSIC 1-Step | 4% | 7% |
| PRO 1-Step | 3% | 3% |
The daily loss limit resets at 00:30 UTC and is set from the higher of balance or equity at that moment. The maximum drawdown is a fixed dollar floor below the starting balance that never moves, as explained in our guide to the static maximum drawdown. Compare those limits with the Kelly fractions above:
- Full Kelly at 10% risk would breach every daily loss limit in the table with one losing trade.
- Half Kelly at 5% risk would use the whole CLASSIC 2-Step daily limit on one loss, and on PRO 1-Step one such loss would exceed the 3% maximum drawdown.
A more practical approach is to size from the limits. Decide how many consecutive losses you want to survive, then divide. On a CLASSIC 1-Step account with a 4% daily limit, risking 0.5% per trade allows about eight losses before the daily limit is reached. The prop trading drawdown calculator shows where the floors sit for a given account, and with no time limit on Velotrade challenges there is no deadline pushing you toward oversized bets.
What does a lucky trade teach about Kelly sizing?
A lucky trade teaches that a good outcome does not prove a good process, which is the trap of sizing up after a winning run. A few big wins can make an edge look larger than it is.
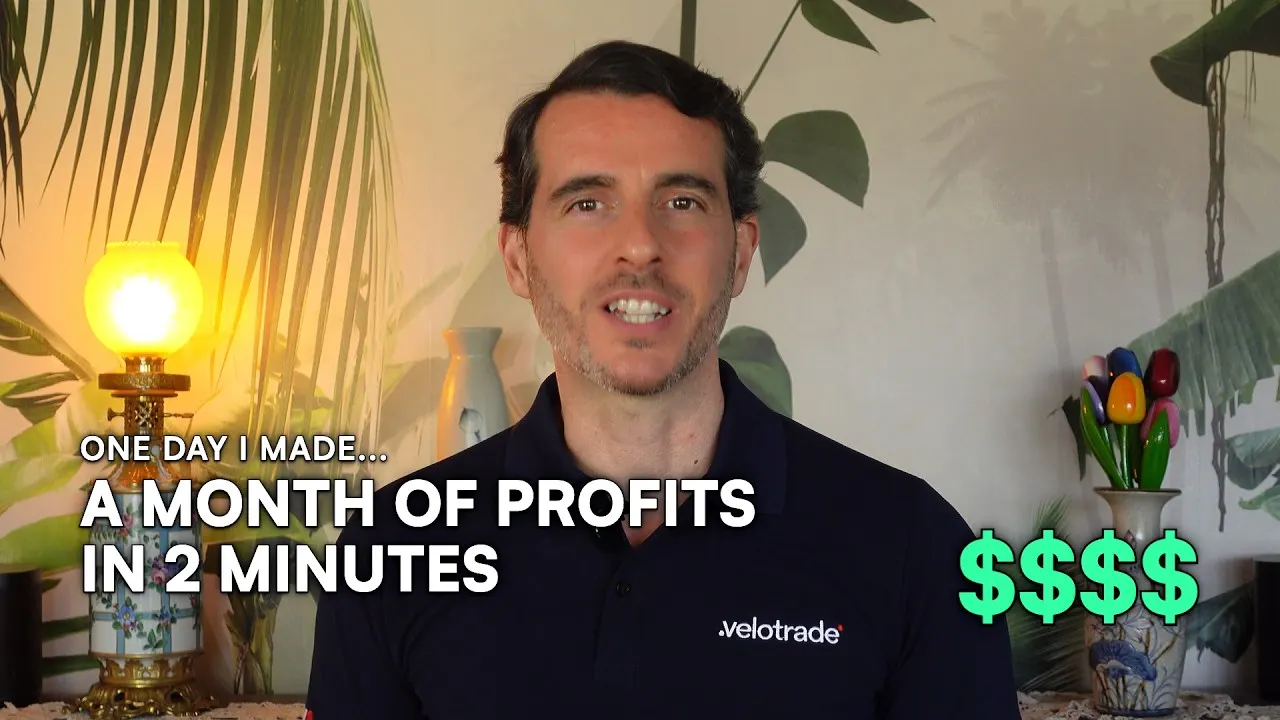
In the video below, Gianluca Pizzituti, Velotrade's co-founder, describes a trade that made a month of profit in minutes because of a coding failure and luck. His verdict: "There was no skill in that outcome." He adds: "A profitable trade can still expose a terrible process."
 4:48
4:48Read the transcript
I once made a month of profit in about two minutes, and it was one of the worst trades of my career.
Further to my last video about the most dangerous winning trade, let me tell you a real story. I am Gianluca Pizzituti, CEO of Velotrade. I've been trading for 25 years, both institutionally and privately.
This story happened when I was trading in Singapore. At the time I was building algorithmic trading strategies, and back then you built almost everything yourself: the logic, the execution, the risk controls, the protection against bad code, hardware failures and software glitches.
Today, many brokers have limits and automatic risk controls. Back then there was much less standing between a coding mistake and a very expensive disaster.
My strategy was a correlation arbitrage between the Nikkei futures trading in Osaka, traded in yen, and the corresponding contracts in Singapore and Chicago, traded in US dollars. The idea was straightforward. If the spread moved far enough, the algorithm would trade one contract and hedge it with one of the others.
My story happened during the normal daily break between the T and T+1 sessions. A couple of days earlier I had made changes to the algorithm, and I must have broken the logic that handled the session gap.
When Osaka entered the break, the system continued treating the last displayed price as credible. That small coding change created a dangerous mismatch between the displayed quote and the actual trading session.
Then there was a sharp move in the S&P 500 futures. That move flowed into the Nikkei contract that was still trading in Singapore. The Singapore price moved. The stale Osaka price did not. To my algorithm, the spread suddenly looked enormous.
I was looking at something else when I heard the sound every electronic trader knows. Boom, boom, boom, boom, boom. It did not stop.
The algorithm kept filling one side and trying to hedge on the Osaka side. But Osaka was closed, so the hedge orders could not execute. Within seconds I had traded hundreds of Nikkei futures on one side and no hedge on the other.
I do not even remember whether I was long or short. I only remember looking at the position and thinking: what on earth has happened?
And then I got lucky. Extremely lucky. The market was thin, the move reversed, and the unhedged orders started filling. I managed to unwind the position at average prices better than the ones my algorithm had originally targeted.
In about two minutes I had made what was probably the profit of the entire month. On paper it looked fantastic. In reality it was a disaster that happened to pay me.
I sat there for several minutes trying to understand what had happened. The code was not protected properly. The market status was not handled correctly. I was distracted. I may have been tired. Several things had failed at the same time.
That position could have moved against me and caused an enormous loss. Instead the market reversed and paid me. But I did not confuse the result with skill. There was no skill in that outcome. It was pure luck.
And that is the point. A profitable trade can still expose a terrible process. If you celebrate the money and ignore the failure, the market may not be so generous next time.
The right response was not to celebrate the profit. It was to recognize that the system had failed, and that pure luck had saved me from a potentially enormous loss. So I stopped, traced the failure and fixed the process. Because a lucky outcome does not make a dangerous mistake acceptable.
If you have ever made money on a trade that you later realized was pure luck, tell me what happened in the comments. See you in the next video.
If a lucky streak inflates your measured win rate, Kelly tells you to bet more at the wrong moment. Investigate a sudden jump in your Kelly fraction before acting on it.
Can AI help with position sizing and the Kelly criterion?
AI can help with the inputs to the Kelly criterion, but it does not remove the risk of getting them wrong. Machine learning tools can analyse a trade journal, split results by market condition, and test how sensitive a strategy is to changes in win rate or payoff. See our guides to AI trading strategies and backtesting trading strategies.
AI cannot guarantee that past win rates will hold, and a model trained on a favourable period can overstate your edge. Any estimate still needs human judgement and a conservative fraction.
Frequently Asked Questions
About the author

Gianluca Pizzituti
Chief Executive Officer
Formerly on the derivatives desk at Dresdner Kleinwort in London, then founded and ran a proprietary HFT firm in FX and equity indices out of Singapore.
View author page