One account, every market we offer
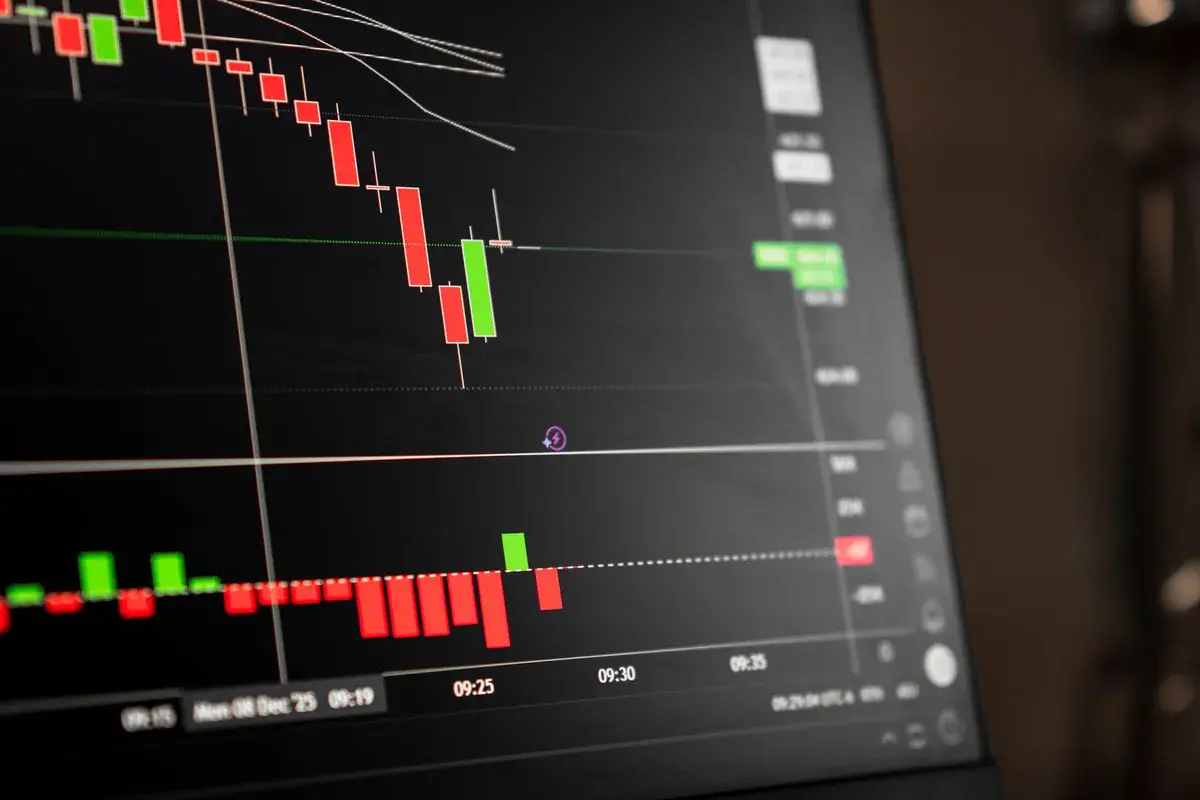
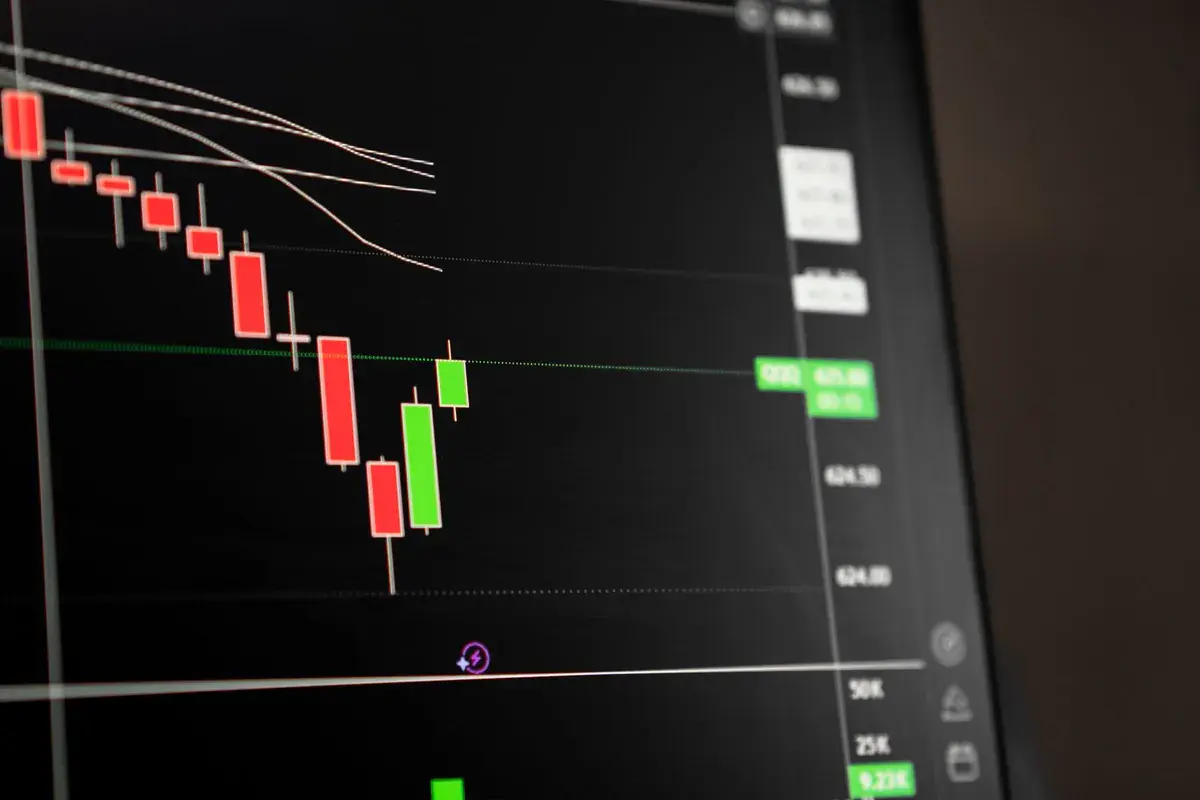
Explore all marketsA hammer candlestick is a single bullish reversal candle with a small body at the top of its range and a long lower wick, at least twice the length of the body, that forms after a decline. The hammer candlestick shows sellers pushing price sharply lower during the session and buyers taking it all back before the close.
The shape has two relatives that look almost identical: the hanging man, which is the same candle after a rally, and the inverted hammer, which is the hammer flipped upside down. Mixing them up is the most common way traders lose money on this pattern. This guide sets out the exact rules for each, what independent tests say about their reliability, and three ways to enter a hammer trade, with a full worked example on gold.
Quick answer: A hammer candlestick has a small body near the high, a lower wick at least twice the body's height and little or no upper wick, and it appears after a downtrend. It signals that buyers rejected lower prices. Traders treat it as confirmed when the next candle closes above the hammer's high, and place the stop below the hammer's low.
Highlights of this article
- The hammer's lower wick should be at least two times the body, with little or no upper wick
- The same shape after a rally is a hanging man; position decides the name, not colour
- Bulkowski's tests show the hammer acting as a bullish reversal 60% of the time, close to random on its own
- The inverted hammer and the hanging man both tested as continuation patterns more often than reversals
- The hammer's low gives a natural stop, so position size should come from that distance
The hammer candlestick checklist
Steve Nison sets out three shape criteria for the hammer in Japanese Candlestick Charting Techniques and adds that it must follow a decline. Bulkowski's identification rules match closely. A candle is a hammer when all of these are true:
- There is a prior decline. Bulkowski requires a downward price trend leading into the candle. Without a decline there is nothing to reverse.
- The lower wick is long. At least two times the height of the body. Bulkowski asks for two to three times.
- The body is at the top of the range. The real body sits in the upper third of the candle.
- There is little or no upper wick. A small one is acceptable. A large one turns the candle into something else.
Colour is a secondary detail. Nison stresses that the body can be either colour. Many traders treat a green hammer as slightly stronger because the close finished above the open, but a red hammer still qualifies. Position and wick length carry most of the weight.
What happens inside a hammer session
Picture the session on a 1-hour chart. Price opens near the prior close, sellers push it down for several hours, stops below a recent low are triggered, and the selling peaks. Then buyers step in, the sellers who shorted the low start covering, and price climbs back to finish near the open. On the daily chart all of that collapses into one candle with a long tail. The tail is the record of prices the market tried and refused.
If the low of that tail pierced an obvious support level and snapped back, check whether it was a liquidity sweep of resting stops. Those often produce perfect-looking hammers.
Want to trade hammers inside a prop firm evaluation? Read why traders fail prop challenges first, then how the top prop firms compare.
Hammer, hanging man and inverted hammer compared
These three candles cause more confusion than any other group of single-candle patterns, so it helps to see them side by side.
| Candle | Shape | Prior trend | Intended signal | Bulkowski tested result | Overall rank (of 103) |
|---|---|---|---|---|---|
| Hammer | Small body on top, long lower wick | Down | Bullish reversal | Bullish reversal 60% | 65 |
| Hanging man | Small body on top, long lower wick | Up | Bearish reversal | Bullish continuation 59% | 87 |
| Inverted hammer | Small body at the bottom, long upper wick | Down | Bullish reversal | Bearish continuation 65% | 6 |
Two things stand out. First, the hammer works only a little better than chance by itself. Bulkowski describes the 60% reversal rate as not far from random. Second, both relatives often fail at the job their name promises. The hanging man more often sees the uptrend continue, and the inverted hammer more often sees the decline continue.
The inverted hammer's rank of 6 refers to how far price moved after a breakout, not how often it reversed. When Bulkowski's inverted hammer does break in its direction, the move is large. That is a different question from whether it predicts direction. Note also that Bulkowski tests the inverted hammer as a two-candle setup: a tall red candle closing near its low, then the inverted hammer opening below that close.
Hammer vs hanging man: same shape, different meaning
A hammer and a hanging man are the same candle. The only difference is the trend before it: a hammer follows a decline and a hanging man follows a rally.
The reading changes with location. After a decline, a long lower wick shows buyers absorbing the selling. After a rally, the same wick shows that sellers were able to drive price down hard during the session, even though buyers recovered it. Nison treats the hanging man as a warning that needs bearish confirmation, ideally a close below the hanging man's body on the next session.
Bulkowski's data supports caution: the hanging man saw a bullish continuation 59% of the time. So treat a hanging man as a reason to tighten a stop on a long position, not as a short signal by itself.
What about the inverted hammer?
The inverted hammer has a small body at the bottom and a long upper wick, appearing after a decline. Buyers tried to push higher and failed to hold it, which is weaker evidence than a hammer, where buyers actually won back the lows. It needs a strong confirmation candle. Its bearish twin, the same shape after a rally, is the shooting star candlestick.


Three ways to enter a hammer trade
Every hammer trade uses the same stop: just below the hammer's low, plus a small buffer for spread. The entry is where traders differ.
| Method | Entry | Advantage | Drawback |
|---|---|---|---|
| Aggressive | At the hammer's close | Best price if it works | No confirmation; many hammers fail next session |
| Confirmation | At the close of a next candle that closes above the hammer's high | Filters immediate failures | Wider stop, lower reward to risk |
| Retracement | Limit order near 50% of the hammer's range after confirmation | Tight stop, high reward to risk | Price may never pull back, so you miss the trade |
Gianluca Pizzituti, Velotrade's co-founder, prefers limit orders on pullbacks. The retracement method suits that approach: confirm first, then wait for price to come back into the hammer's wick.
Worked example: a hammer on gold
The prices are illustrative. Gold falls for five sessions into a support zone around 3,950 that held twice before. The daily candle prints open 3,985, high 3,996, low 3,940, close 3,992.
Check the rules: the body is 7 dollars, the lower wick is 45 dollars (more than six times the body), the upper wick is 4 dollars. It is a hammer at support after a decline. The next candle closes at 4,010, above the hammer's high. Confirmed.
The nearest resistance is the breakdown level at 4,080. Account: $25,000, risking $100 (0.4%) per trade. Stop at 3,936 in every case.
| Method | Entry | Risk per oz | Size | Reward to 4,080 | Reward to risk |
|---|---|---|---|---|---|
| Confirmation | 4,010 | $74 | 1.35 oz | $70 | 0.95R |
| Retracement | 3,968 (50% of range) | $32 | 3.1 oz | $112 | 3.5R |
The confirmation entry is safer but, against this target, it does not pay enough for the risk. The retracement entry pays well but might not fill. A sensible rule is to take the trade only if one method offers at least 1.5R, and to pass when neither does. Here that means placing the limit order at 3,968 and accepting a missed trade if gold never returns.
Hammer candles across markets
- Gold: gold often sweeps a low during the London or New York session and closes back above it, which produces clean hammers at support. Read how to trade gold for its daily rhythm.
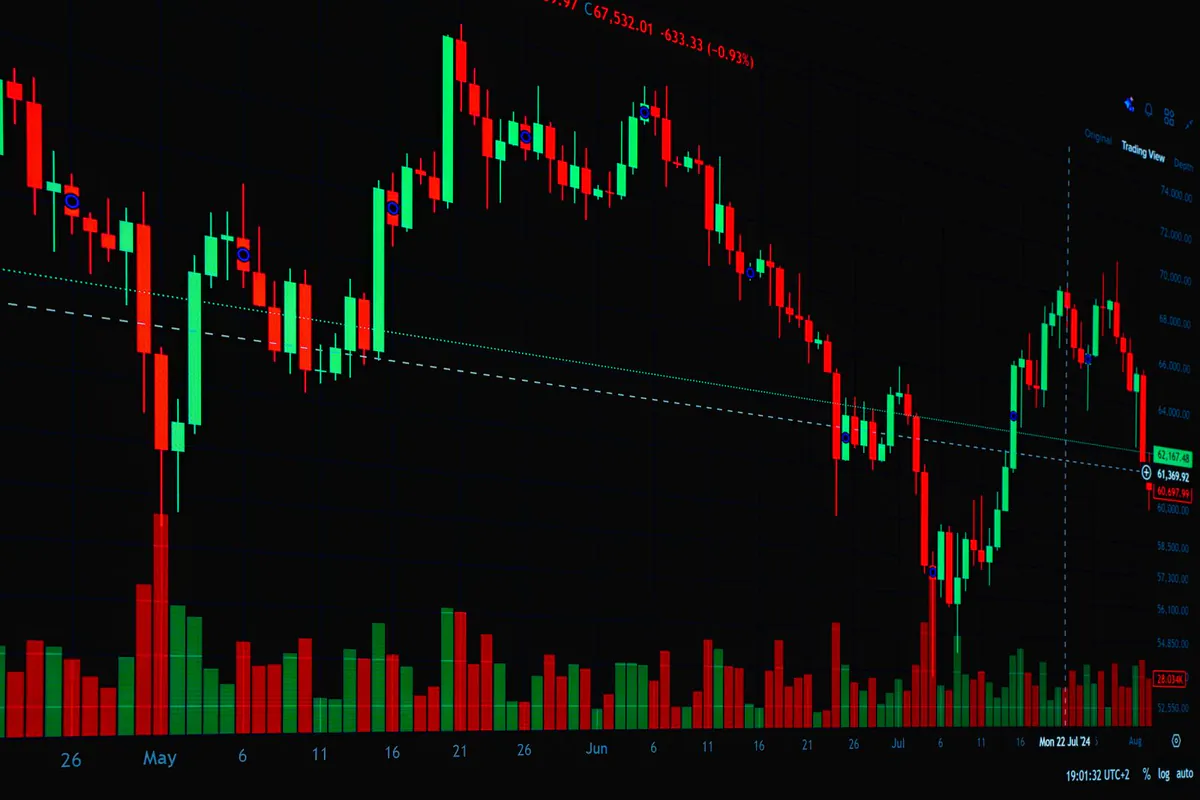
- Crypto: Bitcoin's 24/7 trading and liquidation cascades create very long lower wicks. A crypto hammer during a cascade can have a wick worth several percent, so the stop distance and position size need recalculating every time.
- Forex: major pairs rarely make huge wicks outside news. A daily hammer on EUR/USD with a wick of 80 pips or more after a decline is unusual enough to notice.
- Stocks: a hammer on the day of an earnings gap down is common. Bulkowski's figures come from daily US stock data, so this is the market the test results describe most directly.
Common hammer mistakes
- Calling any long lower wick a hammer. Without a decline before it, the candle has nothing to reverse.
- Shorting every hanging man. The test data shows uptrends continue more often than not after one.
- Ignoring a large upper wick. A hammer with a big upper wick is closer to a spinning top or a doji candle and carries less meaning.
- Putting the stop inside the wick. The whole wick is the evidence. A stop halfway up it sits where the market has already proved it will trade.
- Fixed lot sizes. One hammer has a 20-dollar wick and the next has a 90-dollar wick. The same lot size on both means very different risk.
Using the hammer in a prop firm challenge
The hammer suits a prop challenge because it defines risk clearly: the stop sits under the low, and the size comes from that distance. Velotrade runs simulated evaluations on crypto, forex, stocks, index ETFs and commodities including gold, through DXtrade.
Take the $25,000 PRO 1-Step plan, with a 3% maximum drawdown and a 3% daily loss limit. The static floor sits at $24,250 and never moves, no matter how much profit you make. The daily limit is $750 when set from a $25,000 balance at 00:30 UTC (it is set from the higher of balance or equity, so it scales with your account). At $100 risk per hammer trade, seven straight losses still leave you above both limits.
On the tighter PRO plan, the retracement entry matters more: a smaller stop means a full position without breaching your risk per trade. On CLASSIC plans (10% or 7% maximum drawdown) there is more room, but the logic is the same. See static maximum drawdown explained for how the floor works, and the stop loss guide for stop placement beyond structure.
This article is educational and is not investment advice. Hammers fail often, and the test data says so.
To compare the hammer with two-candle signals such as the engulfing candle, see the full candlestick patterns guide. For confluence at the level itself, read support and resistance.
Sources
- Steve Nison, Japanese Candlestick Charting Techniques, 2nd edition (New York Institute of Finance, 2001): the three criteria for the hammer, the hanging man and its need for confirmation.
- Thomas N. Bulkowski, Encyclopedia of Candlestick Charts (Wiley, 2008), with results published on ThePatternSite: hammer, hanging man and inverted hammer test results and ranks.
- StockCharts ChartSchool, "Candlestick Charts": candle anatomy and single-candle reversal patterns.
Frequently Asked Questions
About the author

Gianluca Pizzituti
Chief Executive Officer
Formerly on the derivatives desk at Dresdner Kleinwort in London, then founded and ran a proprietary HFT firm in FX and equity indices out of Singapore.
Velotrade was founded in Hong Kong in 2016 by a team from JP Morgan, Dresdner Kleinwort and Bank of America, has paid out over $2.5 billion to its trade-finance clients, and has been featured in Bloomberg, the Financial Times, the Wall Street Journal and on Nasdaq. Its prop trading evaluations are simulated and educational.
View author page