One account, every market we offer
Explore all marketsAn engulfing candle is a large candle whose real body completely covers the body of the candle before it and closes in the opposite direction. A bullish engulfing candle forms after a decline, when a big green body swallows a smaller red one. A bearish engulfing candle forms after a rally, when a big red body swallows a smaller green one. In both cases, control switched sides inside a single session.
The engulfing pattern is one of the most frequent two-candle signals on any chart, which makes it popular with traders and with scanners. It is also widely misread, because people confuse it with the harami and the outside bar, or apply stock-market rules to 24-hour markets where they do not fit. This guide covers the rules, the differences, what Thomas Bulkowski's tests found, and a worked trade on an index ETF.
Quick answer: An engulfing candle is the second candle of a two-candle reversal pattern whose body fully covers the prior candle's body. A bullish engulfing appears after a downtrend and signals buyers taking control; a bearish engulfing appears after an uptrend and signals sellers taking control. Shadows are ignored, and the signal is stronger at support or resistance with follow-through on the next candle.
Highlights of this article
- Only bodies count: the second body must cover the first body, and wicks are ignored
- Bulkowski's tests show bearish engulfing reversing 79% of the time and bullish engulfing 63%, well above the near-random rates of most single candles
- The same tests rank both low for the size of the move afterwards, so expect a turn, not necessarily a big one
- An outside bar uses highs and lows; an engulfing candle uses opens and closes; a harami is the inverse shape
- Engulfing candles are large, so stops are wide and position size must shrink to match
The two engulfing patterns
Steve Nison, in Japanese Candlestick Charting Techniques, gives three conditions for an engulfing pattern: the market must be in a clear trend, the second body must engulf the first, and the second body must be the opposite colour to the first. Bulkowski's identification rules on ThePatternSite say the same and add one instruction worth remembering: ignore the shadows.
Bullish engulfing candle
After a decline, a red candle is followed by a taller green candle. Bulkowski's definition: the green candle opens below the prior close and closes above the prior open, so its body covers the red body completely.
Sellers opened the session in control, pushing below the prior close. By the close, buyers had erased the entire prior session and more. Anyone who shorted the previous candle is now losing money.
Bearish engulfing candle
After a rally, a green candle is followed by a taller red candle whose body covers the green body. Buyers opened the session strong, often above the prior close, then sellers took price below the prior open.
The bearish engulfing candle is the more dependable of the two in Bulkowski's test data, as the table further down shows.
Planning to trade engulfing setups in a prop firm evaluation? Read why traders fail prop challenges and how the top prop firms compare first.
Engulfing vs harami vs outside bar
These three are often treated as the same thing. They are not.
| Pattern | What is compared | Second candle vs first | What it shows | Signal strength |
|---|---|---|---|---|
| Engulfing | Bodies (open and close) | Larger body covers the first body, opposite colour | Control changed hands | Stronger |
| Harami | Bodies | Smaller body sits inside the first body | Momentum paused | Weaker, needs confirmation |
| Outside bar | Full range (high and low) | Higher high and lower low than the first | Range expansion | Depends on the close |
Engulfing vs harami
The harami is the engulfing pattern turned inside out. A large first candle is followed by a small candle tucked inside its body. "Harami" means pregnant in Japanese. Where the engulfing candle shows one side taking over, the harami only shows that the previous move stopped. Bulkowski measured the bullish harami as a bullish reversal 53% of the time and the bearish harami as a bullish continuation 53% of the time. Both are close to random. Treat a harami as a pause until a close beyond the first candle's body.
Engulfing vs outside bar
Price action traders often use the outside bar: a bar whose high is above the previous high and whose low is below the previous low. That is a range test, and wicks count. A candle can be an outside bar without being an engulfing candle (it can close in the middle) and an engulfing candle without being an outside bar (its wicks can sit inside the prior wicks). The strongest version satisfies both: a candle that takes out both extremes and closes beyond the prior body. More on bar-based reading in price action trading.
Why 24-hour markets change the rules
On a daily stock chart, overnight news creates gaps, so a bullish engulfing candle can open below the prior close and close above the prior open. In crypto and forex there is usually no gap: each candle opens exactly where the previous one closed. Bulkowski's strict rule (open beyond the prior close) almost never triggers.
Traders handle this by relaxing the rule: the second candle opens at or near the prior close and closes beyond the prior open. That is a reasonable adjustment, but be aware that the test statistics below come from daily US stocks with real gaps. If you trade Bitcoin or EUR/USD, run your own backtesting on the relaxed definition before relying on the numbers.


What Bulkowski's tests show
| Pattern (Bulkowski) | Tested behaviour | Overall rank (of 103) | Frequency rank |
|---|---|---|---|
| Bearish engulfing | Bearish reversal 79% of the time | 91 | 11 |
| Bullish engulfing | Bullish reversal 63% of the time | 84 | 12 |
| Bullish harami | Bullish reversal 53% of the time | 38 | n/a |
| Bearish harami | Bullish continuation 53% of the time | 72 | n/a |
There is an apparent paradox here. The bearish engulfing reversed 79% of the time, far above the 50% to 60% that most single candles managed. Yet its overall performance rank, which reflects how far price moved after the breakout, is 91 of 103. In plain terms: the engulfing pattern is good at predicting that the next move will go its way and weak at predicting a large move.
That has a direct trading implication. Targets should be realistic, usually the nearest level rather than a distant one, and the trade has to work with a stop that is often wide because the engulfing candle itself is large.
What makes one engulfing candle better than another
- Size relative to recent candles. An engulfing body two or three times the average body of the last 10 candles shows a real shift. Compare it to the ATR indicator reading.
- Location. A bullish engulfing at support, or a bearish engulfing at the right shoulder of a head and shoulders pattern, has structure behind it.
- Engulfing more than one candle. A green body that covers the last two or three red bodies shows more force than one that barely covers a single small candle.
- Volume. Higher volume on the engulfing candle than on the candle it covers shows broader participation.
- A tiny first candle is a weak signal. If the first body is a doji candle or a spinning top, almost any candle engulfs it. Most traders want a meaningful first body.
Trading an engulfing candle: entry, stop and target
- Confirm there is a clear trend into the pattern.
- Check the engulfing body covers the prior body, ignoring wicks.
- Enter at the engulfing close, at the next open, or on a limit order back toward the engulfing candle's midpoint.
- Place the stop beyond the engulfing candle's extreme: below its low for a bullish engulfing, above its high for a bearish one.
- Target the nearest opposing level and check the reward is at least 1.5 times the risk.
The midpoint entry is popular because a large engulfing candle makes the stop from the close very wide. A pullback halves the stop distance, at the cost of sometimes missing the trade.
Worked example: a bullish engulfing on SPY
Prices are illustrative. SPY, the S&P 500 index ETF, pulls back for four sessions into a prior breakout level near 583. Day 1 closes red: open 588.40, close 584.10. Day 2 opens at 583.50, below the prior close, falls to 582.70, then rallies to close at 590.20, above the prior open of 588.40. The high is 590.80. That is a textbook bullish engulfing with a real gap down open.
- Entry: 590.20 at the engulfing close
- Stop: 582.40, 30 cents below the engulfing low, a risk of $7.80 per share
- Target: 602.00, the recent swing high, a reward of $11.80 per share (about 1.5R)
- Size: risking $500 (0.5% of $100,000), $500 ÷ $7.80 is 64 shares, about $37,770 notional
Costs matter on a swing trade. At 0.03% commission per side, the round trip is about $23. An overnight fee of 0.05% of notional is about $19 per night, so holding five nights costs about $94, almost a fifth of the planned risk. Factor that in when you decide whether 1.5R is enough.
Engulfing candles across markets
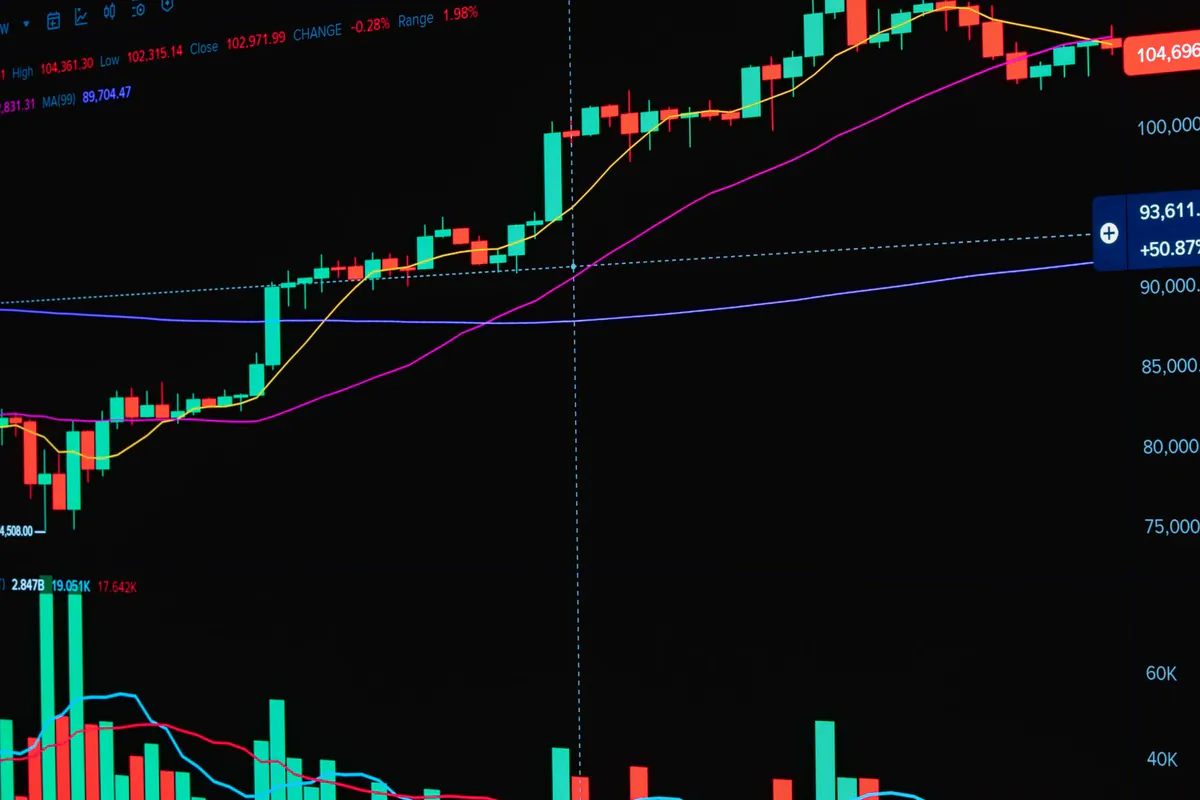
Index ETFs and stocks. Daily gaps make the strict definition achievable, and this is where Bulkowski's data applies directly. Earnings-day engulfing candles are common but reflect one event.
Crypto. Without gaps, you rely on the relaxed definition. A daily bullish engulfing on Bitcoin that also sweeps the prior low (an outside bar too) is the version worth watching.
Forex. Engulfing candles on major pairs often form on central bank or jobs data days. The daily close after the news matters more than the spike.
Gold. Gold often prints bearish engulfing candles after a failed push to a new high during the New York session. A close below the prior day's open is the key detail.
Common engulfing mistakes
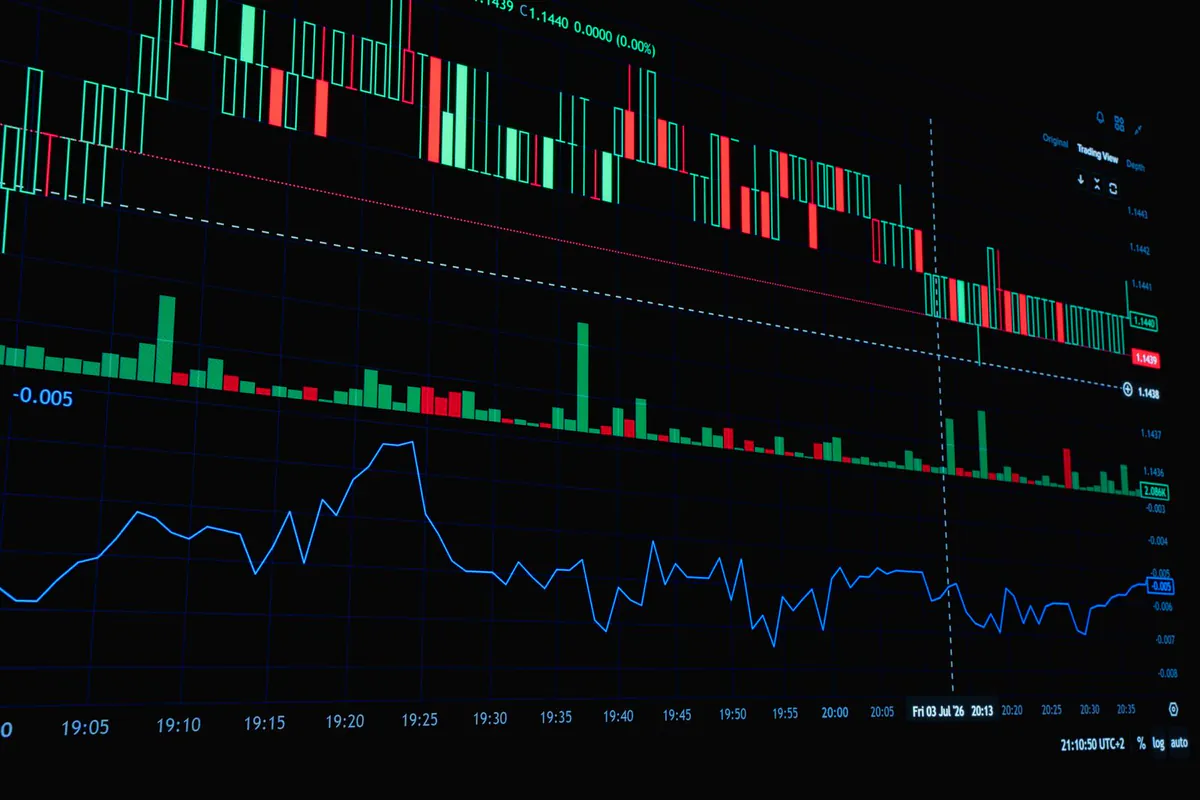
- Counting wicks. The bodies define the pattern. An engulfing candle whose wicks fit inside the prior wicks is still valid.
- Trading it mid-range. Without a trend into it, an engulfing candle is just a big candle.
- Distant targets. The test data shows engulfing moves tend to be modest. Target the nearest level.
- Full size on a wide stop. A large engulfing candle can mean a stop twice as wide as usual. Halve the size, or wait for the midpoint pullback.
- Confusing it with a harami. Small inside big is a harami. Big covering small is engulfing.
Using engulfing candles in a prop firm challenge
Engulfing candles produce large stops, and a prop challenge is decided by how losses add up. Velotrade runs simulated evaluations across crypto, forex, stocks, index ETFs such as SPY and QQQ, and commodities, with a static maximum drawdown: a fixed dollar floor that does not move as the account grows.
On a $100,000 CLASSIC 2-Step account, the 10% maximum drawdown sets the floor at $90,000, and the 5% daily loss limit is $5,000 when set from a $100,000 balance (it resets at 00:30 UTC from the higher of balance or equity). The SPY example risked $500, so it would take 10 straight full losses to hit the daily limit and 20 to reach the floor. Index ETFs carry up to 6x leverage in the challenge phase, and the example used well under 1x.
There is no consistency rule and no time limit, and weekend holding is allowed, so a daily engulfing trade can run for several sessions. Watch the overnight cost on longer holds. For stop placement, read the stop loss guide, and for how the floor works, static maximum drawdown explained.
This article is educational and is not investment advice. Even the most consistent candlestick patterns fail often.
For the single-candle signals, see the hammer candlestick and shooting star candlestick guides, and for every pattern in one table, the full candlestick patterns guide.
Sources
- Steve Nison, Japanese Candlestick Charting Techniques, 2nd edition (New York Institute of Finance, 2001): the three criteria for engulfing patterns and the harami.
- Thomas N. Bulkowski, Encyclopedia of Candlestick Charts (Wiley, 2008), with results published on ThePatternSite: bullish engulfing, bearish engulfing, bullish harami and bearish harami test results and ranks.
- StockCharts ChartSchool, "Candlestick Charts": construction of engulfing and harami patterns.
Frequently Asked Questions
About the author

Gianluca Pizzituti
Chief Executive Officer
Formerly on the derivatives desk at Dresdner Kleinwort in London, then founded and ran a proprietary HFT firm in FX and equity indices out of Singapore.
Velotrade was founded in Hong Kong in 2016 by a team from JP Morgan, Dresdner Kleinwort and Bank of America, has paid out over $2.5 billion to its trade-finance clients, and has been featured in Bloomberg, the Financial Times, the Wall Street Journal and on Nasdaq. Its prop trading evaluations are simulated and educational.
View author page