One account, every market we offer
ExplorePrice action trading is a way of making trading decisions from the price chart itself: the swings, the levels and the shape of individual candles, with few or no indicators. A price action trader asks three questions before every trade. Which way is the market moving? Where are the important levels? What is price doing at that level right now?
Quick answer: Price action trading means reading raw price, not indicators, to decide when to trade. Traders identify market structure (higher highs or lower lows), mark key support and resistance levels, then wait for a candlestick signal at those levels, such as a pin bar, inside bar or engulfing candle, with a stop beyond the signal.
Highlights of this article
- Price action combines three layers: market structure, key levels and candlestick signals at those levels
- A candle pattern in the middle of nowhere means little; the same pattern at a tested level means more
- Pin bars, inside bars and engulfing candles are the three most used price action signals
- Price action is flexible but subjective, so written rules and a journal are essential
- In a prop evaluation, the stop goes beyond the signal candle and size is set from that stop, not from conviction
Funded accounts
Ready to get funded?
Trade up to $200,000 in firm capital with static drawdown, no consistency rule, and payouts within 24 hours. Pass the challenge and keep up to 90% of your profits.
Get funded from $40Price action trading key facts
| Item | Detail |
|---|---|
| Definition | Trading decisions based on price movement itself: swings, levels and candle shapes |
| Core layers | Market structure, key levels, candlestick signal at the level |
| Common signals | Pin bar, inside bar, bullish or bearish engulfing |
| Indicators needed | None required; some traders add a moving average or volume for context |
| Timeframes | Any, from 5 minutes to weekly; higher timeframes give cleaner levels |
| Main risk | Subjectivity: seeing patterns that confirm what you already want to do |
| Related terms | Candlestick patterns, support and resistance, chart patterns, break of structure |
What is price action trading?
Price action trading is a discretionary style in which the chart is the main input and indicators are optional. Every indicator, from RSI to MACD, is calculated from past prices, so a price action trader prefers to read that information directly rather than through a delayed, smoothed version of it.
Good price action traders work from a short list of setups with fixed rules for context, trigger, stop and target. It is one of the core approaches in the trading strategies library and underpins most of the others.
Does price action trading work?
Price action can give useful information, but there is no evidence that any one pattern is profitable on its own, and results depend on the trader's rules, costs and discipline.
Academic work on chart reading is mixed. Lo, Mamaysky and Wang (2000), in an NBER paper later published in the Journal of Finance, built an automatic pattern-recognition method and applied it to US stocks from 1962 to 1996. They found that several technical patterns provided incremental information and "may have some practical value". Carol Osler's research at the Federal Reserve Bank of New York found that support and resistance levels published by forex firms helped predict intraday trend interruptions, though the predictive power varied across currencies and firms.
Neither finding means a pin bar is a money machine. Both suggest that where a signal appears matters, which is why price action traders focus on levels first and candles second.
How do you read market structure?
You read market structure by marking swing highs and swing lows and asking whether they are rising, falling or flat.
- Uptrend: higher highs and higher lows. Look mainly for long setups at support.
- Downtrend: lower highs and lower lows. Look mainly for short setups at resistance.
- Range: highs and lows at roughly the same levels. Trade the edges or wait for a breakout.
A trend changes when that sequence breaks: an uptrend that makes a lower low has lost its structure. The break of structure guide shows how to mark these swings consistently. A simple habit is to read structure on a higher timeframe first, such as the daily chart, and then look for entries on a lower one, such as the 1-hour.
Payout proof
Fast, real payouts. Traceable on Arbitrum.
- Paid within 24 hours of approval
- Settled on Arbitrum in USDC or USDT
- Look up any transaction on Arbiscan


How do you find key levels?
You find key levels by marking prices where the market has turned more than once, because those are where orders tend to cluster.
The most useful levels are:
- Prior swing highs and lows on the daily and 4-hour charts
- Previous day, week and month highs and lows
- Round numbers, such as 1.1000 on EURUSD or 100,000 on Bitcoin
- Broken levels that may flip, where old resistance becomes support
Osler's work on currency orders found that stop-loss and take-profit orders cluster strongly at round numbers, which helps explain why these levels attract reactions. The support and resistance guide covers how to draw levels as zones rather than single lines.
Which candlestick signals matter at key levels?
The candlestick signals that matter most at key levels are the pin bar, the inside bar and the engulfing pattern. Each shows a shift in who controlled the candle. For a fuller list, see candlestick patterns.
Pin bar
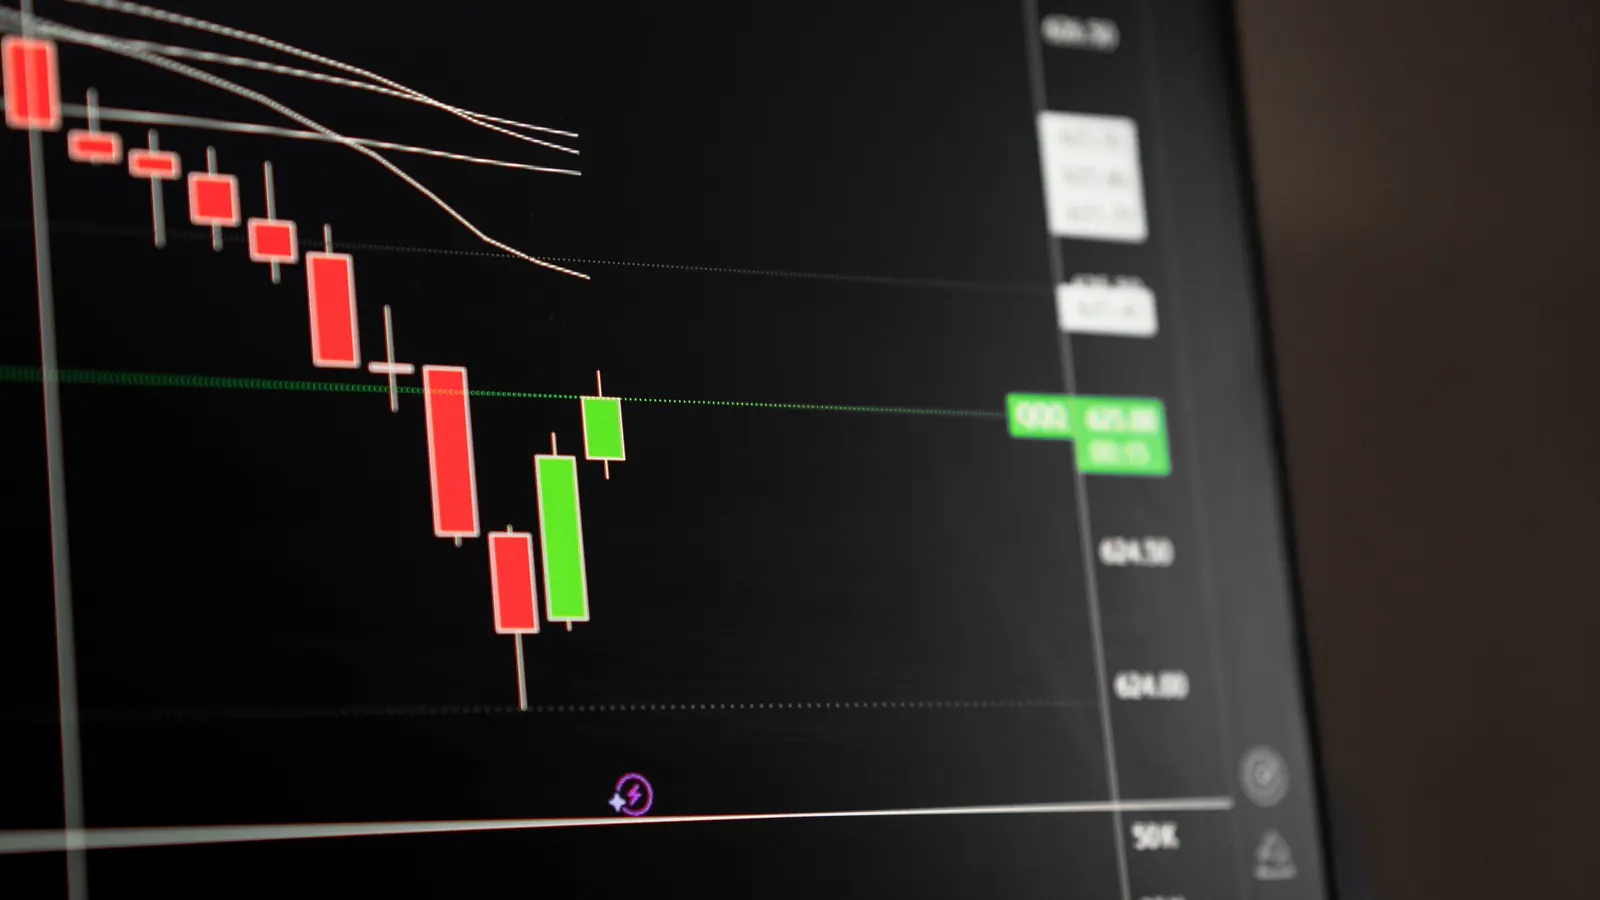
A pin bar has a small body and a long wick, at least about two thirds of the candle's range, pointing toward the level. A bullish pin bar at support (a hammer shape) shows price traded below the level and was pushed back up before the close. The bearish version at resistance (a shooting star shape) shows the opposite. The stop usually goes just beyond the tip of the wick.
Inside bar
An inside bar is a candle whose high and low both sit within the previous candle's range. It shows a pause or compression. Traders place an order to buy above the inside bar's high or sell below its low, ideally in the direction of the trend, with the stop on the other side of the mother bar or the inside bar.
Engulfing pattern
A bullish engulfing pattern is a down candle followed by an up candle whose body completely covers the prior body. At support after a pullback it shows buyers taking over decisively. The bearish engulfing pattern at resistance is the mirror image. Engulfing candles are large, so the stop distance is often wider than with a pin bar.
A simple price action trading strategy
A simple price action trading strategy combines all three layers into a checklist that you apply the same way every time.
- Context. On the daily chart, define the trend by swing structure. Only take longs in an uptrend and shorts in a downtrend.
- Level. Mark the nearest tested support (for longs) or resistance (for shorts). The level must have caused at least one clear reaction before.
- Signal. Wait for a pin bar, inside bar breakout or engulfing candle that closes at the level on your entry timeframe.
- Entry. Enter on a break of the signal candle's high (longs) or low (shorts), so price confirms the signal before you are in.
- Stop. Place the stop beyond the signal candle's extreme, plus a small buffer for spread.
- Target. Use the next opposing level, such as the most recent swing high. Skip the trade if that target is less than 2R away.
- Risk. Size the position so the stop costs a fixed 0.25% to 1% of the account.
Step 6 filters out many weak setups. A beautiful pin bar with an opposing level just above it offers little reward for the risk; the risk-reward ratio guide explains why.
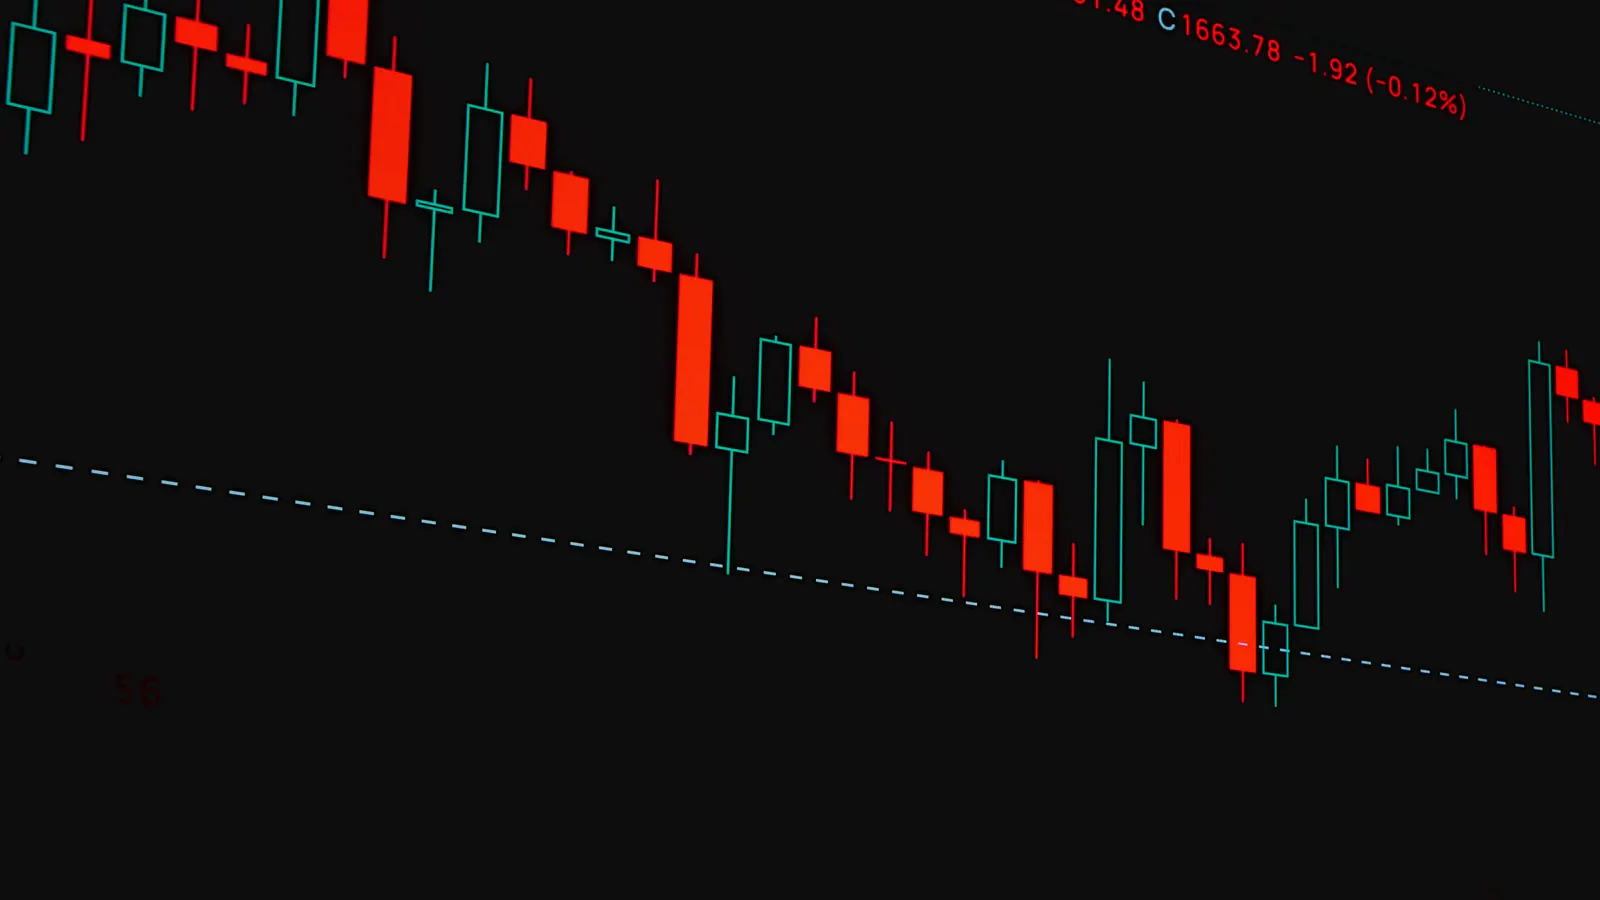
Worked example: a pin bar on EURUSD in a 10,000 USD account
This hypothetical example uses a 10,000 USD CLASSIC 1-Step evaluation at Velotrade, a multi-asset prop trading firm offering simulated evaluations. Prices are illustrative.
Account limits
- Static maximum drawdown: 7%, so the account must stay above 9,300 USD. Total loss budget: 700 USD.
- Daily loss limit: 4%, set at 00:30 UTC from the higher of balance or equity. On day one that is 400 USD.
The setup
- The daily chart of EURUSD shows higher highs and higher lows.
- Price pulls back to 1.0800, a level that acted as resistance two weeks earlier and then broke.
- A 4-hour pin bar forms with a low of 1.0782 and closes back above 1.0800. Its high is 1.0811.
The trade
- Buy stop at 1.0812, just above the pin bar's high.
- Stop-loss at 1.0777, 5 pips below the wick. Stop distance: 35 pips.
- Risk per trade: 0.5% of 10,000 USD = 50 USD.
- On EURUSD a standard lot (100,000 units) is worth about 10 USD per pip, so 50 / 35 = 1.43 USD per pip, which is 0.14 lots (14,000 euros).
- Notional value is about 15,100 USD, around 1.5x leverage, well inside the 50x challenge leverage on forex majors. Forex commission is 0.004% per side, about 0.60 USD each way.
- Target: the recent swing high at 1.0882, 70 pips away, or 2R. If hit, the profit is about 98 USD.
Risk check. At 50 USD per loss, the trader can absorb 14 full losses before reaching the static floor, and 8 before reaching the day-one daily limit. A trader who risked 2% (200 USD) on the same setup would have only three losses of room before the floor.
How does price action trading fit prop firm rules?
Price action trading fits prop firm rules well because every setup has a defined stop, which makes position sizing straightforward. The firm's limits are hard edges; your own limits should sit inside them.
| Plan | Daily loss limit | Static max drawdown | Profit target |
|---|---|---|---|
| CLASSIC 2-Step | 5% | 10% | 10%, then 5% |
| CLASSIC 1-Step | 4% | 7% | 10% |
| PRO 1-Step | 3% | 3% | 10% |
Points that matter for price action traders on Velotrade:
- No per-trade risk cap. There is no maximum risk per trade, so discipline must come from your own rules. A fixed 0.5% risk is a common starting point.
- Daily limit maths. The daily loss limit resets at 00:30 UTC from the higher of balance or equity. Set a personal daily stop, such as two full losses, well inside it.
- Static drawdown. The floor is fixed from the starting balance and does not trail profits. See static maximum drawdown explained.
- News. News trading is allowed, but levels can break violently on major releases, and spreads can widen. Many price action traders stand aside for a few minutes around high-impact data.
- Single stocks. Positions must be closed at least 24 hours before an earnings release, and single stocks carry tighter holding rules.
Intraday price action traders should compare conditions in best prop firm for day trading, and you can see all plan details on the challenges page. Evaluations start from 40 USD, with an 80% profit split and an optional paid 90% add-on on funded accounts.
Price action versus indicator trading
| Price action | Indicator trading | |
|---|---|---|
| Main input | Swings, levels, candles | Calculated values such as RSI or MACD |
| Speed of signal | Immediate | Often lagged by the calculation |
| Objectivity | Lower; needs written rules | Higher; signals are mechanical |
| Ease of backtesting | Harder; patterns need precise definitions | Easier to code and test |
| Best for | Discretionary traders who review charts closely | Systematic traders and those who want clear triggers |
Many traders combine the two, using price action for entries and a single indicator, such as a 50-period moving average or the ATR, for trend context or stop distance. The technical indicators guide covers the most common ones.
Common price action trading mistakes
- Trading every pin bar. Without a level and a trend, most candle signals are noise.
- Drawing too many levels. If every price is a level, none of them is. Keep the two or three most obvious on each timeframe.
- Ignoring the higher timeframe. A bullish 15-minute engulfing candle straight into daily resistance is a low-quality trade.
- Moving the stop after entry. The stop was placed where the setup is wrong. Widening it turns a planned loss into an unplanned one.
- No journal. Price action is subjective, so a trading journal with screenshots is the only way to see which setups actually work for you.
Price action is the foundation for several other approaches in the library. Zones built from strong departures are covered in supply and demand trading, and holding with the trend in trend following. This article is educational and not investment advice. Trading involves risk, and simulated results do not guarantee future performance.
Sources
- Investopedia, "Mastering Price Action": definition of price action and how traders use it.
- Investopedia, "An Introduction to Price Action Trading Strategies": common price action approaches.
- NBER, Lo, Mamaysky and Wang, "Foundations of Technical Analysis": automated pattern recognition on US stocks, 1962 to 1996.
- Federal Reserve Bank of New York, Osler, "Support for Resistance": support and resistance and intraday exchange rates.
- Federal Reserve Bank of New York, Osler, "Currency Orders and Exchange-Rate Dynamics": order clustering at round numbers.
- Investopedia, "Hammer Candlestick": the hammer shape behind the bullish pin bar.
- Investopedia, "Bullish Engulfing Pattern": definition and example.
Frequently Asked Questions
About the author

Gianluca Pizzituti
Chief Executive Officer
Formerly on the derivatives desk at Dresdner Kleinwort in London, then founded and ran a proprietary HFT firm in FX and equity indices out of Singapore.
Velotrade was founded in Hong Kong in 2016 by a team from JP Morgan, Dresdner Kleinwort and Bank of America, has paid out over $2.5 billion to its trade-finance clients, and has been featured in Bloomberg, the Financial Times, the Wall Street Journal and on Nasdaq. Its prop trading evaluations are simulated and educational.
View author page