One account, every market we offer
Explore all marketsA shooting star candlestick is a single bearish reversal candle that forms after a rally, with a small body near the low of its range, a long upper wick at least twice the body's height and little or no lower wick. The shooting star candlestick records a session where buyers pushed price to a new high and sellers then drove it all the way back down.
The candle gets its name from the image of a star trailing a long tail across the sky, and like a real shooting star it is brief. Without follow-through on the next session, it is only a wick. This guide explains how to identify a shooting star precisely, how it differs from the inverted hammer and the gravestone doji, what Thomas Bulkowski's tests say about its record, and how to plan a short trade with entry, stop and target, using a worked Bitcoin example.
Quick answer: A shooting star candlestick is a bearish reversal signal with a small real body at the bottom of the range and a long upper shadow, appearing after an uptrend. It shows that buyers lost control of a push to new highs. Traders usually wait for the next candle to close lower before shorting, with the stop placed just above the shooting star's high.
Highlights of this article
- A shooting star needs a prior rally, a small body near the low and an upper wick at least two times the body
- The identical shape after a decline is an inverted hammer, which is read as bullish
- Bulkowski's tests show a bearish reversal 59% of the time, which he calls near random on its own
- Location is the filter: a shooting star at resistance or above a prior high carries far more weight
- The stop goes above the wick's high; the size comes from that distance
What a shooting star looks like at a top
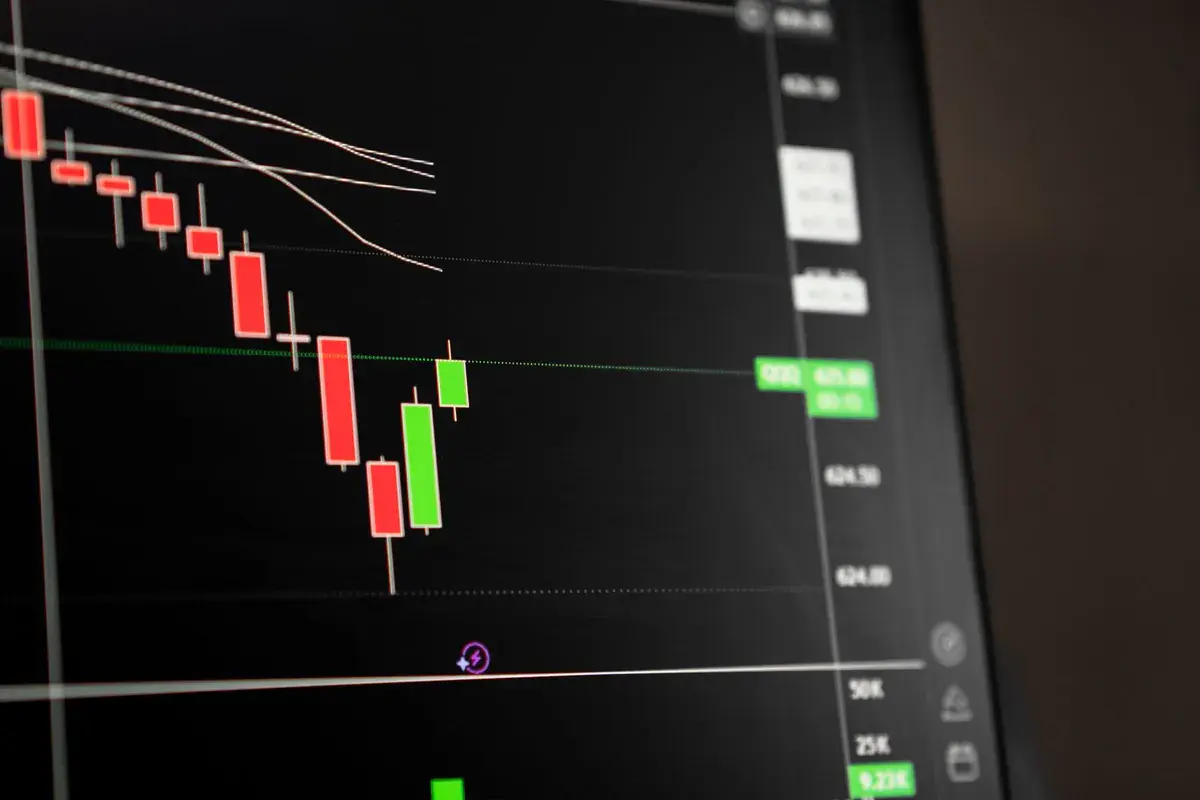
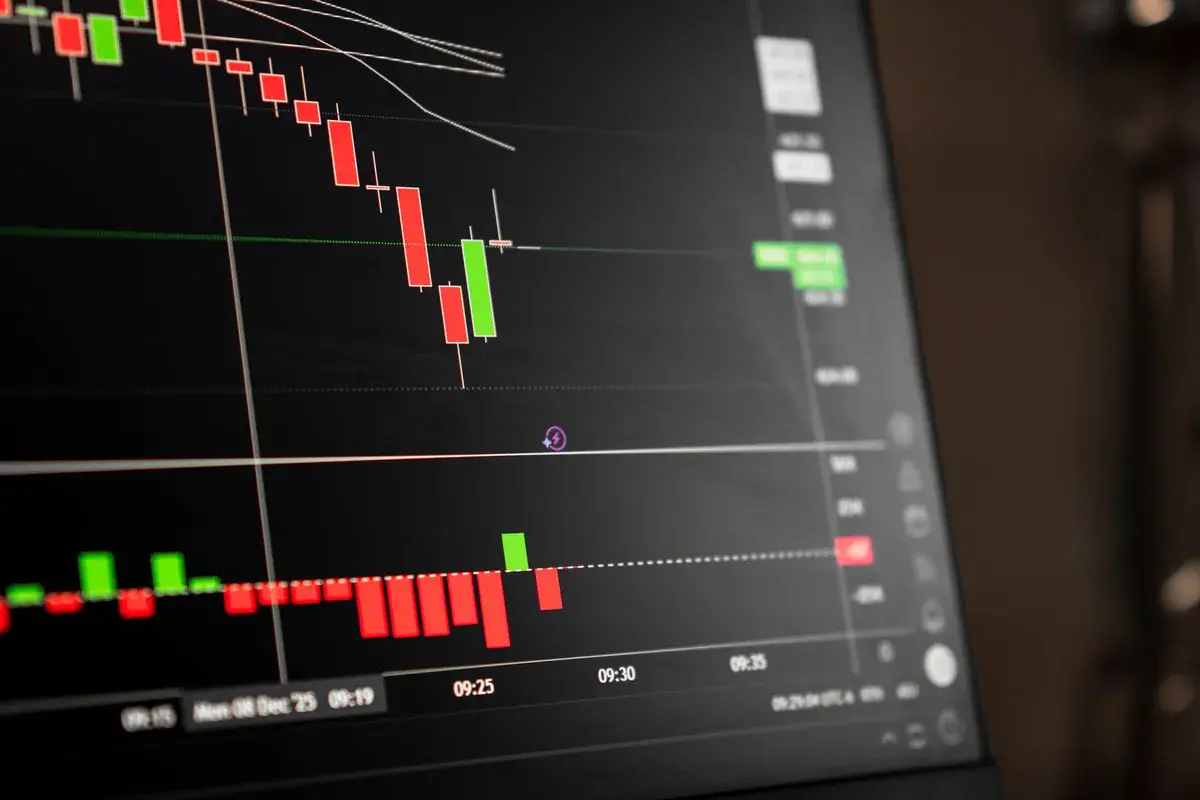
Imagine a market that has rallied for a week. Each candle closes near its high. Then one session opens, rallies hard through the recent high, attracts late buyers, and stalls. Sellers hit the bids, price slides back, and the candle closes near where it opened. On the chart you see a small body at the bottom and a tall wick pointing up, like a flag planted at the exact prices the market rejected.
The upper wick is the evidence. Every trader who bought in that wick is now holding a loss, and if price keeps falling their exit orders add to the selling. That is the mechanism behind the pattern, and it is why the shooting star works best where many traders bought at once: a breakout above a prior high or a test of resistance.
Identification rules
Bulkowski's rules on ThePatternSite and Steve Nison's description in Japanese Candlestick Charting Techniques agree on the core:
| Rule | Requirement | Why it matters |
|---|---|---|
| Prior trend | Upward | A bearish reversal needs a rally to reverse |
| Body | Small, near the low of the range, not a doji | Shows the close gave back the session's gains |
| Upper wick | At least two times the body's height | The size of the rejected push |
| Lower wick | Little or none | A large lower wick makes it a spinning top |
| Colour | Either | A red body is slightly stronger, not required |
Nison adds that an ideal shooting star gaps up from the prior body. Gaps are common on daily stock charts and rare in crypto and forex, which trade almost continuously, so most traders drop the gap requirement on those markets.
Thinking about trading shooting stars in a prop firm evaluation? Read why traders fail prop challenges and how the top prop firms compare.
Shooting star vs inverted hammer vs gravestone doji
Three candles share the same silhouette: a long upper wick on top of a small body at the bottom. They differ by the trend before them and by body size.
| Candle | Body | Prior trend | Intended signal | Bulkowski tested result |
|---|---|---|---|---|
| Shooting star | Small, not a doji | Up | Bearish reversal | Bearish reversal 59%, overall rank 55 of 103 |
| Inverted hammer | Small, not a doji | Down | Bullish reversal | Bearish continuation 65%, overall rank 6 of 103 |
| Gravestone doji | Open and close nearly equal | Bulkowski requires none | Bearish reversal after a rally | Bearish reversal 51%, overall rank 77 of 103 |
Shooting star vs inverted hammer
The shooting star and the inverted hammer are the same shape. The shooting star follows a rally and is bearish. The inverted hammer follows a decline and is meant to be bullish, because buyers at least tried to push higher. The inverted hammer is the weaker signal in its intended direction: in Bulkowski's tests it saw the decline continue 65% of the time. It is covered alongside the hammer and hanging man in the hammer candlestick guide.
Shooting star vs gravestone doji
A gravestone doji is a shooting star with no measurable body: open and close are nearly equal at the low. Traditional analysts treat it as the more extreme rejection. Bulkowski's numbers do not show it performing better; it tested at 51%, essentially random. See the doji candle guide for every doji type.
What Bulkowski's numbers mean for a trader
A 59% bearish reversal rate sounds useful until you set it against costs and the fact that some of those reversals are tiny. Bulkowski himself describes it as near random. The overall performance rank of 55 out of 103 puts it in the middle of the candlestick patterns he tested.
Two practical conclusions follow:
- The candle alone is not an edge. You need filters: location, confirmation, momentum.
- Reward to risk does the work. If the pattern is right only slightly more than half the time, you need winners larger than losers. A trade that risks 1 to make 1 does not pay after commissions. Aim for 1.5R or more, checked with the risk to reward ratio.
Bulkowski's data comes from daily US stocks, so treat it as a guide rather than a law for crypto or forex. Test the pattern on your own market with backtesting.


Filters that make a shooting star worth trading
- A level above. The wick pierced a prior swing high, a round number or a known resistance zone and closed back below it. That is often a sweep of buy stops, covered in the liquidity sweep guide.
- An extended move. Several large green candles before the shooting star mean the rally is stretched. A shooting star after two small candles means little.
- Momentum divergence. Price made a higher high in the wick, while the RSI indicator made a lower high.
- Volume on the rejection. Heavy volume on the shooting star shows many buyers were caught in the wick.
- A larger pattern. A shooting star at the second peak of a double top has the bigger structure on its side.
How to confirm and enter a shooting star short
Traders confirm the shooting star in one of three ways, from loose to strict:
- The next candle closes below the shooting star's body.
- The next candle closes below the shooting star's low.
- Price breaks the most recent swing low, a break of structure.
Stricter confirmation means fewer false signals and a worse entry price. The stop belongs just above the shooting star's high in every case, because a new high cancels the rejection.
Worked example: a shooting star on Bitcoin
Prices are illustrative. Bitcoin rallies for three days on the 4-hour chart into a prior high at 103,500. A 4-hour candle prints open 101,200, high 103,900, low 101,050, close 101,400. The body is 200 dollars, the upper wick 2,500 dollars (more than 12 times the body), the lower wick 150 dollars. The wick swept the 103,500 high and closed back below it.
The next 4-hour candle closes at 100,600, below the shooting star's low. That is rule 2 confirmation.
| Confirmation entry | Pullback entry | |
|---|---|---|
| Entry | Short at 100,600 | Limit sell at 102,000, into the wick |
| Stop | 104,100 (200 above the high) | 104,100 |
| Risk per BTC | $3,500 | $2,100 |
| Target | 94,800, prior support | 94,800 |
| Reward per BTC | $5,800 | $7,200 |
| Reward to risk | 1.66R | 3.4R |
| Size at $75 risk | 0.0214 BTC, about $2,150 notional | 0.0357 BTC, about $3,640 notional |
The confirmation entry fills for sure and pays a reasonable 1.66R. The pullback entry pays more but needs price to bounce back up into the wick, which often does not happen after a strong rejection. Some traders split the position across both.
Shooting stars in crypto, forex, stocks and gold
Crypto. Leveraged long liquidations can produce huge upper wicks in seconds. On a 4-hour or daily candle that wick is real information. On a 1-minute candle it can be a single liquidation.
Forex. Shooting stars on EUR/USD or GBP/USD often form at the London or New York session highs, when early buyers are trapped. A daily shooting star at a weekly resistance level carries the most weight.
Stocks. Daily stock shooting stars often follow a gap up on news. If the gap fully closes and the stock finishes near the open, the reversal case is stronger.
Gold. Gold frequently spikes on US data releases and then fades. A shooting star on the day of a release partly reflects the news spike, so wait for the next session's close.
Common shooting star mistakes
- Shorting without a prior rally. The shape in a range or after a decline is not a shooting star.
- Ignoring a big lower wick. Wicks on both sides make it a spinning top or a long-legged doji, which signal indecision, not rejection.
- Stops below the high. A stop inside the wick sits where price already traded.
- Shorting every upper wick in a strong uptrend. Strong trends print many shooting stars that fail. Wait for a level and confirmation.
- Using the same size on every trade. Crypto wicks vary enormously. Size from the stop distance each time.
Using the shooting star in a prop firm challenge
Shooting stars are short trades, and a prop challenge treats them the same as longs: risk is defined before entry. Velotrade runs simulated evaluations across crypto, forex, stocks, index ETFs and commodities on DXtrade, with no consistency rule and no time limit.
On a $10,000 CLASSIC 1-Step account, the maximum drawdown is 7%, so the static floor sits at $9,300 and never moves. The daily loss limit is 4%, set at 00:30 UTC from the higher of balance or equity, so $400 from a $10,000 start. At $75 risk per trade, as in the Bitcoin example, five straight losses cost $375 and stay inside the daily limit, and nine losses still stay above the floor. For a pattern that the test data puts near 59%, that buffer matters.
Bitcoin carries leverage of up to 10x in the challenge phase, but leverage is not the risk number. The example used about $2,150 of notional on a $10,000 account. Commission on crypto is 0.03% per side, which is under one dollar on that position. Place the stop beyond the wick, then size. For more, read the stop loss guide and static maximum drawdown explained.
This article is educational and is not investment advice. Shooting stars fail often, and the size of each loss is the part you control.
For the two-candle bearish alternative, see the engulfing candle guide, and for every pattern in one table, the full candlestick patterns guide.
Sources
- Steve Nison, Japanese Candlestick Charting Techniques, 2nd edition (New York Institute of Finance, 2001): definition of the shooting star, the gap, and its relation to the inverted hammer.
- Thomas N. Bulkowski, Encyclopedia of Candlestick Charts (Wiley, 2008), with results published on ThePatternSite: shooting star, inverted hammer and gravestone doji test results and ranks.
- StockCharts ChartSchool, "Candlestick Charts": candle construction and single-candle reversal patterns.
Frequently Asked Questions
About the author

Gianluca Pizzituti
Chief Executive Officer
Formerly on the derivatives desk at Dresdner Kleinwort in London, then founded and ran a proprietary HFT firm in FX and equity indices out of Singapore.
Velotrade was founded in Hong Kong in 2016 by a team from JP Morgan, Dresdner Kleinwort and Bank of America, has paid out over $2.5 billion to its trade-finance clients, and has been featured in Bloomberg, the Financial Times, the Wall Street Journal and on Nasdaq. Its prop trading evaluations are simulated and educational.
View author page