One account, every market we offer
Explore all marketsA spinning top candlestick is a candle with a small real body sitting near the middle of its range, with a wick above and a wick below that are longer than the body. The spinning top candlestick records a session where price moved up and down but closed close to where it opened, so neither buyers nor sellers finished ahead.
It is also the most common candle on a chart. In Thomas Bulkowski's study of 103 candlestick types, the black and white spinning tops rank first and second for frequency. This guide shows how to measure a spinning top, how it differs from a doji and a high wave candle, where it does carry information, and how to plan a trade around one with a worked EUR/USD example.
Quick answer: A spinning top candlestick has a small body and upper and lower shadows that are both longer than the body. It signals indecision: buyers and sellers were both active and the session ended near its open. On its own it is neutral. After a strong move or at a key level it can warn that momentum is fading, and the next candle's close decides the direction.
Highlights of this article
- A spinning top has a small body near the middle of the range and a wick on each side longer than the body
- The colour of the body carries little weight; the message is balance between buyers and sellers
- Bulkowski's tests show a reversal 50% to 51% of the time, and it is the most frequent candle of the 103 he studied
- It matters after a long run of large candles or at a level, and means little inside a sideways range
- Trade the close beyond the spinning top's high or low, with the stop on the opposite side
Spinning top anatomy in numbers
The name comes from the child's toy: a small round body with a stem. The clearest way to learn the shape is to measure one. Take a 4-hour candle with these prices:
| Price | Value |
|---|---|
| Open | 100.00 |
| High | 101.50 |
| Low | 98.70 |
| Close | 100.40 |
The full range is 2.80. The body is 0.40, which is 14% of the range. The upper wick is 1.10 and the lower wick is 1.30. Both wicks are about 3 times the body. Price travelled 1.30 below the open and 1.50 above it, and still closed only 0.40 from where it started.
Three checks turn the picture into a rule:
- Small body. A common working threshold is a body of roughly one third of the range or less. Below about 5% to 10% of the range, most traders call the candle a doji.
- A wick on each side. Each wick is longer than the body. If one wick is missing, you are looking at a hammer or a shooting star shape, not a spinning top.
- Body near the middle. The two wicks are of broadly similar length, so the body does not hug the top or the bottom of the range.
These thresholds are working conventions, and the sources do not fully agree. Steve Nison, in Japanese Candlestick Charting Techniques, calls any candle with a small real body a spinning top and treats the length of the shadows as secondary. Bulkowski's definition on ThePatternSite is narrower: a small body with shadows taller than the body. This guide follows the narrower version.
Bullish and bearish spinning tops
A spinning top with a green or white body closed a little above its open. One with a red or black body closed a little below. Some sources call these bullish and bearish spinning tops.
The labels promise more than the candle delivers. Bulkowski tested the two colours separately. The black spinning top acted as a reversal 51% of the time and the white spinning top 50% of the time. He describes the white version as acting randomly.
So do not buy because a spinning top is green or sell because it is red. Wait for the candle after it.
Spinning top vs doji and high wave
Three candles share the theme of indecision. They differ in body size and wick length.
| Candle | Body | Wicks | What Bulkowski's tests found |
|---|---|---|---|
| Spinning top | Small, but clearly visible | Both longer than the body | Reversal 50% (white) and 51% (black); frequency ranks 2 and 1 of 103 |
| High wave | Small, not a doji | Both very tall | Reversal 51%; frequency rank 17 of 103 |
| Doji | Open and close nearly equal, a thin line | Any length | Covered type by type in the doji guide |
Spinning top vs doji. The only difference is the body. A spinning top has a small block between open and close. A doji has almost none. The doji is the more extreme version of the same message. Each doji type and its test data are in the doji candle guide.
Spinning top vs high wave. A high wave candle is a spinning top with unusually long wicks. Bulkowski notes that it resembles a long-legged doji, with the difference that the high wave has a real body.
Spinning top vs marubozu. These are opposites. A spinning top is mostly wick and shows balance. A marubozu is all body and shows one side in control from open to close. A spinning top printing right after a large full-bodied candle is one of the more useful sequences on a chart, and the marubozu candle guide covers the first half of it.
Spinning top vs hammer and shooting star. Those candles have one long wick and a body at the opposite end of the range. They show rejection in one direction. A spinning top shows rejection in both. See the hammer candlestick guide and the shooting star candlestick guide for the one-sided versions.
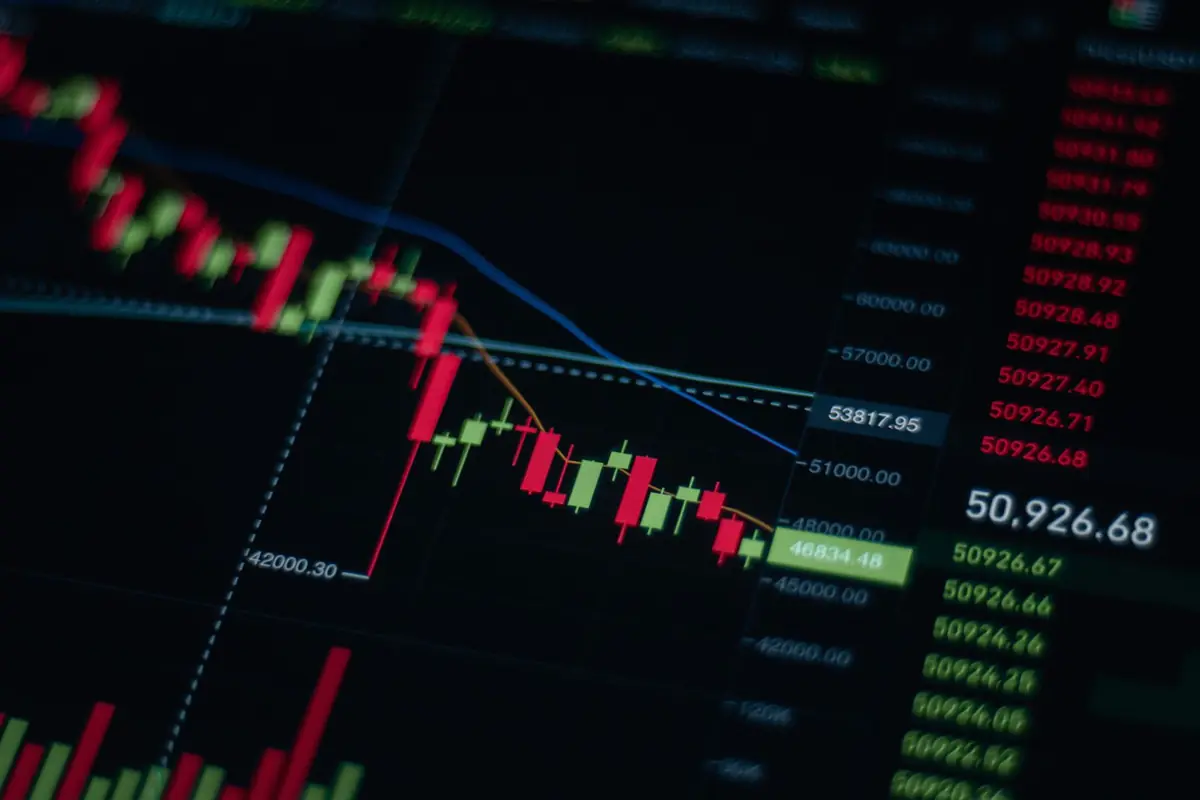
What a spinning top means depends on where it prints
The candle is the same in every row of this table. The reading is not.
| Where it appears | What it suggests | What to wait for |
|---|---|---|
| After a long rally with large green candles | Buyers are no longer pushing price away from the open | A close below the spinning top's low |
| After a long decline with large red candles | Sellers are no longer driving price lower with ease | A close above the spinning top's high |
| At a tested support or resistance level | The level is being contested | A close away from the level, in either direction |
| In the middle of a sideways range | Nothing new; the range is made of these | No action |
StockCharts' ChartSchool makes the same point: after a long advance or a long white candle, a spinning top indicates weakness among the bulls and a potential change or interruption in trend. The word to notice is "potential".
A spinning top that forms at a level other traders are watching has a reason to matter. The support and resistance guide explains how to mark those levels before the candle prints, which is the correct order.


Spinning tops inside larger patterns
The spinning top does its most useful work as a component of multi-candle patterns.
- Morning star. A large red candle, then a small-bodied candle, then a large green candle that closes well into the first candle's body. The middle candle is often a spinning top.
- Evening star. The mirror image at a top.
- Harami. A large candle followed by a small candle whose body sits inside the first body. The small candle is frequently a spinning top.
In each case, the spinning top is the hinge and the next candle is the confirmation. A decisive candle that covers the whole spinning top is closely related to the pattern in the engulfing candle guide.
What the test data says
Bulkowski's numbers come from daily US stock data.
- Direction is random. Reversal rates of 50% and 51% mean the spinning top does not predict which way price leaves.
- It is everywhere. Frequency ranks of 1 and 2 out of 103 make it the most common candle type he catalogued.
- Follow-through is weak. Overall performance ranks are 73 for the black spinning top and 69 for the white, out of 103.
- Two things helped in his tests. Spinning tops within a third of the yearly low performed best, and those with shadows taller than the median outperformed those with shorter shadows.
His theoretical label for the candle is "indecision", and the tests agree. You do not trade the spinning top. You trade the candle that resolves it, at a location that gave the spinning top a reason to matter.
How to trade around a spinning top
- Check the run-up. Is there a clear move into the candle, ideally 4 or more candles mostly in one direction? If the chart is sideways, stop here.
- Check the location. Is price at a marked level, a prior swing high or low, or a round number? A spinning top at a new high while the RSI indicator makes a lower high is a stronger warning.
- Mark the high and the low. These two prices are the triggers. Nothing happens between them.
- Act on the close. A close below the low after a rally is the short signal. A close above the high cancels the warning and says the trend has resumed.
The stop goes beyond the opposite end of the spinning top. For a short, that is above the high. Because spinning tops have long wicks, that stop is often wider than it looks, and the position has to be sized to fit it. The stop loss guide covers the sizing.
Worked example: a spinning top on EUR/USD
Prices are illustrative. EUR/USD rallies for 5 sessions on the 4-hour chart, from 1.1480 into a resistance level at 1.1650 that turned price twice in the previous month. A 4-hour candle then prints:
- Open 1.1632
- High 1.1658
- Low 1.1608
- Close 1.1638
The range is 50 pips. The body is 6 pips, or 12% of the range. The upper wick is 20 pips and the lower wick is 24 pips. That is a spinning top at a level, after a run. If the pip arithmetic is new, see what is a pip.
The triggers are 1.1658 and 1.1608. Two outcomes are possible.
Outcome A: the next candle closes at 1.1596. That is 12 pips below the spinning top's low, so the short signal is live.
| Item | Value |
|---|---|
| Entry | Short at 1.1596 |
| Stop | 1.1663, 5 pips above the spinning top's high |
| Risk | 67 pips |
| Target | 1.1480, the start of the rally |
| Reward | 116 pips |
| Reward to risk | About 1.7R |
| Size at $50 risk | 0.07 lots, about $47 at risk |
| Notional | 7,000 euros, about $8,100 |
On a standard lot of EUR/USD, 1 pip is worth $10, so 67 pips is $670 per lot. Dividing $50 by $670 gives 0.0746 lots, rounded down to 0.07. Always round down. If the target is reached, the trade makes about $81.
Outcome B: the next candle closes at 1.1671. That is above the spinning top's high and above resistance. There is no short. The spinning top was a pause inside the rally, which is what it turns out to be about half the time. A trader who shorted the spinning top itself would now be holding a loss against a breakout.

Which timeframe works best
On 1-minute and 5-minute charts, spinning tops are constant, because short sessions often end near where they began. The candle starts to carry information from the 1-hour chart upward, and a daily or weekly spinning top after a long trend deserves attention. In forex, the quiet Asian session prints many of them simply because the range is small.
Common mistakes with spinning tops
- Trading the candle itself. It has no direction. Wait for the close beyond its high or low.
- Reading it in a range. Sideways markets are built from spinning tops. They say nothing there.
- Setting the stop inside the wicks. Price has already traded there once. Put the stop beyond the far end.
- Forgetting the higher timeframe. One level up, the same hours may be part of a strong trend candle.
Using the spinning top in a prop firm challenge
A spinning top teaches patience, which suits an evaluation where every loss counts against fixed limits.
Velotrade runs simulated, educational evaluations across crypto, forex, stocks, index ETFs and commodities on DXtrade. On a $10,000 CLASSIC 2-Step account, the daily loss limit is 5%, which is $500 at the start, and the maximum drawdown is 10%. The drawdown is static, so the floor is $9,000 and it stays there.
The EUR/USD example risked about $50, or 0.5% of the account. At that size, it takes 10 full losses in one day to reach the daily limit and 20 in a row to reach the floor. With a signal that resolves either way about half the time, losing streaks are normal, and that buffer absorbs them. Funded traders keep an 80% profit split.
This article is educational and is not investment advice. A spinning top tells you the market paused. What happens next is not in the candle.
For the full list of single-candle and multi-candle signals, see the candlestick patterns guide.
Sources
- Steve Nison, Japanese Candlestick Charting Techniques, 2nd edition (New York Institute of Finance, 2001): spinning tops as small real bodies, high wave candles, and the star and harami patterns.
- Thomas N. Bulkowski, Encyclopedia of Candlestick Charts (Wiley, 2008), with results published on ThePatternSite: black spinning top, white spinning top and high wave: definitions, reversal rates, frequency ranks and performance ranks.
- StockCharts ChartSchool, "Introduction to Candlesticks": spinning tops as indecision and their meaning after a long advance or decline.
Frequently Asked Questions
About the author

Gianluca Pizzituti
Chief Executive Officer
Formerly on the derivatives desk at Dresdner Kleinwort in London, then founded and ran a proprietary HFT firm in FX and equity indices out of Singapore.
Velotrade was founded in Hong Kong in 2016 by a team from JP Morgan, Dresdner Kleinwort and Bank of America, has facilitated over $2.5 billion in trade-finance payments, and has been featured in Bloomberg, the Financial Times, the Wall Street Journal and on Nasdaq. Its prop trading evaluations are simulated and educational.
View author page