One account, every market we offer
Explore all marketsAn evening star candlestick is a three-candle bearish reversal that forms at the top of a rally: a tall green candle, a small-bodied candle that sits above it, and a tall red candle that closes at least halfway down the first candle's body. The evening star candlestick tells you that buyers reached a high, stalled there for a session, and then lost the ground they had just won.
Traders use it in two ways. Some short it. Others, already long, treat it as a reason to take profit or tighten a stop. Both uses depend on reading the pattern correctly, and most mistakes come from accepting a weak third candle or ignoring where the pattern formed. This guide covers the rules from Steve Nison and Thomas Bulkowski, how the evening star compares with other topping signals, what Bulkowski's test data really says, and a worked short on a stock chart with position size.
Quick answer: An evening star candlestick is a bearish reversal made of 3 candles after an uptrend: a long green candle, a small candle of either colour whose body sits above the first body, and a long red candle that closes below the midpoint of the first candle's body. It signals that buying pressure has faded at the high. Traders short on the close of the third candle or on a retest, with the stop above the pattern's highest point.
Highlights of this article
- An evening star needs a prior rally, a tall green candle, a small candle above it and a tall red candle closing below the midpoint of candle 1
- Bulkowski's tests show a bearish reversal 72% of the time, ranking 10th of 103 candle types for reversal rate
- It is rare: a frequency rank of 71 means long waits between clean examples
- The pattern works as a short entry and as an exit signal for existing longs
- The stop goes above the highest high of the 3 candles, which is often far away, so size has to shrink
What an evening star looks like
Picture a market that has climbed for several sessions. The pattern then unfolds over 3 candles:
- A tall green candle. The rally is still healthy. Price opens near the low of the session and closes near the high.
- A small candle at the top. The next session opens higher, sometimes with a gap, but goes almost nowhere. The body is small. It can be green, red or a doji. This is the star.
- A tall red candle. The third session opens below the star's body and sells off. It closes at least halfway down the body of the first candle.
The middle candle is the turning point. Buyers opened it with enthusiasm and finished it with nothing to show. When the third candle then falls through the first candle's midpoint, everyone who bought during the last 2 sessions is underwater. Their selling is what drives the follow-through.
The pattern is the upside-down twin of the morning star candlestick, which forms at the bottom of a decline. The logic is the same with the roles swapped.
Evening star rules, measured
Bulkowski's identification guidelines on ThePatternSite describe the pattern like this: a tall white candle in an upward price trend, then a small-bodied candle of any colour whose body gaps above the bodies of the 2 candles next to it, then a tall black candle that opens below the prior candle and closes at least midway down the body of the first day. Shadows are ignored for the gap test.
Turn that into 4 checks you can run on any chart:
Check 1: the trend. Price must have been rising into the pattern. A handful of higher closes is the minimum. After a decline or inside a range, the same 3 candles are not an evening star.
Check 2: the star's body. Compare its size with candle 1. It should be a fraction of it. Then check its position: the body should sit above candle 1's close.
Check 3: the midpoint. Add candle 1's open and close and divide by 2. Candle 3 must close below that number. If candle 1 opened at 100 and closed at 110, the midpoint is 105, and a third candle closing at 106 does not qualify.
Check 4: the size of candle 3. It should be tall, comparable to candle 1. A small red candle that just dips under the midpoint is a weak signal.
Want to practise short setups on a simulated account before risking your own capital? Compare the challenge plans first.
The evening star without gaps
The gap rules were written for markets that close each day. Daily stock and index ETF charts gap regularly, so a star that floats above both neighbours is realistic there.
Crypto never closes, and spot forex only gaps over the weekend. On those charts, the star almost always opens at the prior close. Traders adapt by keeping the 3 parts that carry the meaning: a tall green candle, a small body near its top, and a tall red candle that closes below the midpoint. The gap is treated as a bonus when it appears.
The statistics later in this article come from daily US stocks under the strict rules, so a 1-hour Bitcoin evening star is a related but untested cousin.
Evening star variations
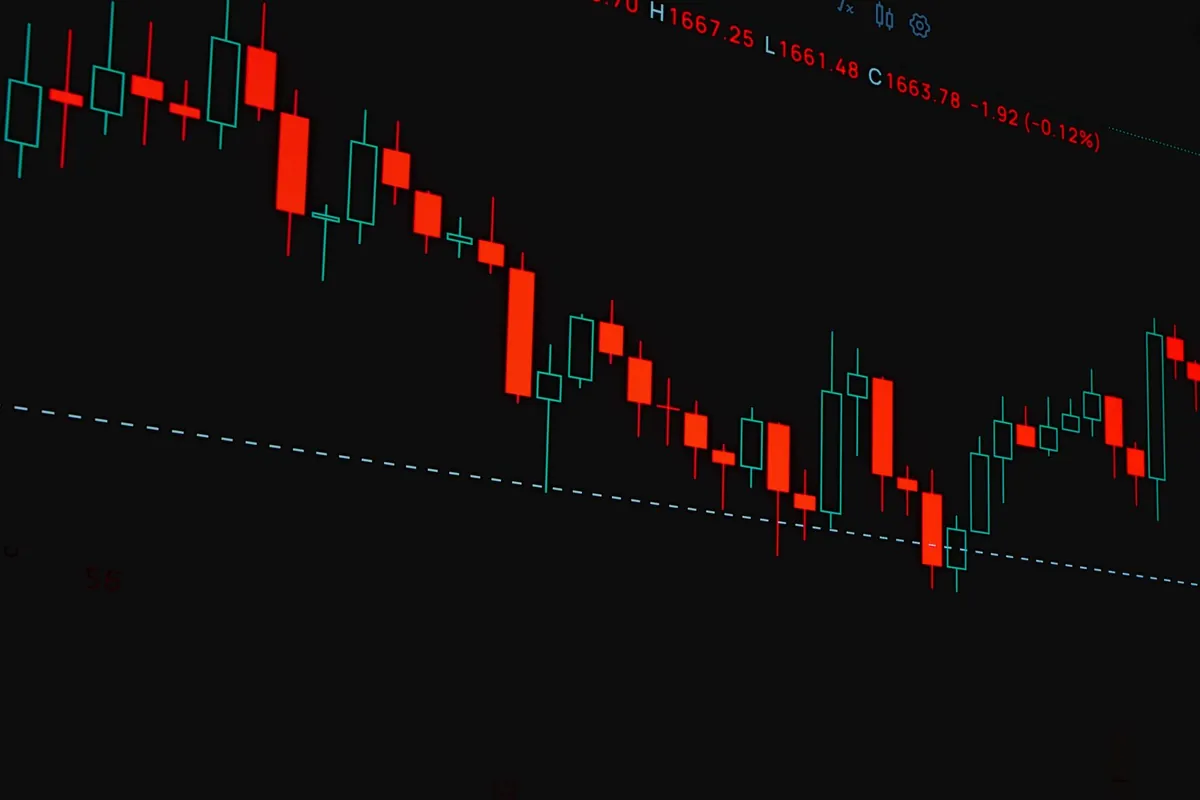
Evening doji star. The middle candle is a doji, with the open and close nearly equal. Many books call it the more powerful version. In Bulkowski's data it reversed 71% of the time against 72% for the plain evening star, and its overall rank was lower at 30. The extra indecision did not add an edge. For the doji types themselves, see the doji candle guide.
Bearish abandoned baby. The middle doji gaps away from both neighbours, including the shadows, so no part of its range overlaps theirs. It is the strictest version and the rarest. In markets that do not gap, it is close to impossible.
Evening star vs other topping signals
Several bearish candles compete for attention at a high. They differ in how many sessions they take and how much they prove.
| Signal | Candles | What it shows | Bulkowski tested behaviour | Overall rank (of 103) | Frequency rank |
|---|---|---|---|---|---|
| Evening star | 3 | Stall at the high, then sellers take back half the prior candle | Bearish reversal 72% | 4 | 71 |
| Evening doji star | 3 | Same, with a doji as the star | Bearish reversal 71% | 30 | 81 |
| Bearish engulfing | 2 | A red body covers the prior green body | Bearish reversal 79% | 91 | 11 |
| Shooting star | 1 | A push higher rejected inside one session | Bearish reversal 59% | 55 | 37 |
| Bearish harami | 2 | A small body inside the prior green body | Bullish continuation 53% | 72 | 26 |
The single-candle shooting star candlestick is common and close to random on its own. The 2-candle bearish engulfing candle reverses more often than the evening star but ranks near the bottom for the size of the move that follows. The evening star sits in a different place: less frequent, a solid reversal rate and a high performance rank.
The harami row is a warning. A bearish harami, the inside-out version of the engulfing pattern covered in the bullish harami guide, continued higher more often than it reversed. A small candle after a big green one is not enough. The evening star needs the third candle for a reason.


What Bulkowski's numbers really say
The headline figures look excellent: a 72% reversal rate, 10th of 103, and an overall performance rank of 4. Read the detail before trusting the headline.
Bulkowski defines a breakout as a close above the top of the pattern or below the bottom of it. He reports that the evening star breaks out downward most often. He also writes that most of the pattern's strong performance comes from upward breakouts, not downward ones, and that the best 10-day move in his data was a rise of 8.77% after an upward breakout in a bear market, based on only 63 samples. He expects that number to shrink with more data.
Put plainly: when an evening star fails and price closes above its high, the move up can be sharp. That is a squeeze of everyone who shorted the pattern. The high performance rank partly reflects those failures.
Two lessons follow for a short seller:
- The stop above the high is not optional. A close above the pattern cancels the signal, and what comes next can be fast.
- Context decides. Bulkowski's own tip is to trade the evening star when it appears in an upward retracement of a primary downtrend. A bounce inside a falling market that ends in an evening star has the larger trend behind the short. An evening star in a powerful bull trend is fighting it.
Two ways to use an evening star
As a short entry
- Confirm the rally and mark the nearest resistance. An evening star at a prior high or a known ceiling is stronger. The support and resistance guide shows how to mark those zones.
- Wait for candle 3 to close. Do not anticipate it halfway through the session.
- Enter at the close, or place a limit order to sell a bounce back into candle 3's body.
- Place the stop above the highest high of the 3 candles, with a buffer. See the stop loss guide for buffer sizing.
- Target the nearest support and confirm the risk to reward ratio is at least 1.5.
As an exit signal
Many traders never short. For them, an evening star on a position they already hold is a prompt to act:
- Take partial profit at the close of candle 3.
- Move the stop on the remaining position up to just under candle 3's low.
- Stop adding to the position until price closes back above the star.
This use opens no new risk. It reduces existing risk when the chart shows buyers hesitating.
Worked example: an evening star on a tech stock
Prices are illustrative. A large technology stock rallies from 410 to 455 over 6 sessions and approaches a prior high at 462.
- Candle 1: open 448.00, close 459.50, high 460.40. A green body of 11.50.
- Candle 2: gaps up to open at 462.80, high 465.20, low 461.30, close 461.90. A body of 0.90, above candle 1's body.
- Candle 3: opens at 458.20, below the star's body, and closes at 450.10 with a low of 449.20.
The midpoint of candle 1 is (448.00 + 459.50) ÷ 2, which is 453.75. Candle 3 closed at 450.10, below it. The star's high at 465.20 poked above the prior high at 462 and failed. All 4 checks pass.
| Short at candle 3 close | Short on a retest | |
|---|---|---|
| Entry | 450.10 | Limit sell at 454.00 |
| Stop | 466.00 (0.80 above the pattern high) | 466.00 |
| Risk per share | $15.90 | $12.00 |
| Target | 425.00, the prior breakout level | 425.00 |
| Reward per share | $25.10 | $29.00 |
| Reward to risk | 1.58R | 2.42R |
| Size at $300 risk | 18 shares, about $8,100 notional | 25 shares, about $11,350 notional |
One caution is specific to stocks. They gap. If the company reports earnings or the market opens sharply higher, a short can open beyond its stop and lose more than planned.
Common evening star mistakes
- Accepting a shallow third candle. If candle 3 closes above the midpoint of candle 1, the pattern has not formed.
- Shorting it in a strong uptrend with no level. Strong trends print many brief stalls. Without resistance overhead, most of them resolve higher.
- Entering before the close. A candle that is deep red at midday can finish as a small-bodied candle. Wait.
- Using a normal position size. The stop sits above 3 candles of range. Size from the stop distance each time.
- Confusing a pause with a top. A single hesitation candle after a tall green one, such as the hanging man covered in the hammer candlestick guide, is not an evening star until the third candle confirms.
Using the evening star in a prop firm challenge
Shorting a top is a wide-stop trade, and losing streaks on shorts in a rising market are common. Velotrade runs simulated, educational evaluations across crypto, forex, stocks, index ETFs and commodities on DXtrade, and every plan uses a static maximum drawdown: a fixed dollar floor set from the starting balance.
The PRO 1-Step plan is the tightest. On a $100,000 PRO account, the daily loss limit and the maximum drawdown are both 3%, so the floor sits at $97,000. The worked example risked $300 per trade. At that size, 10 straight losses would use the full $3,000. A trader risking $1,000 per evening star would have room for 3. The pattern's test record does not change that arithmetic.
This article is educational and is not investment advice. Evening stars fail, sometimes sharply, and the loss per trade is the part you decide.
For every candle signal in one table, see the full guide to candlestick patterns.
Sources
- Steve Nison, Japanese Candlestick Charting Techniques, 2nd edition (New York Institute of Finance, 2001): the star family of reversal patterns, including the evening star and evening doji star.
- Thomas N. Bulkowski, Encyclopedia of Candlestick Charts (Wiley, 2008), with results published on ThePatternSite: evening star, evening doji star, bearish engulfing, shooting star and bearish harami identification guidelines, test results and ranks.
- StockCharts ChartSchool, "Candlestick Bearish Reversal Patterns": construction of the evening star and the reasoning behind each candle.
Frequently Asked Questions
About the author

Gianluca Pizzituti
Chief Executive Officer
Formerly on the derivatives desk at Dresdner Kleinwort in London, then founded and ran a proprietary HFT firm in FX and equity indices out of Singapore.
Velotrade was founded in Hong Kong in 2016 by a team from JP Morgan, Dresdner Kleinwort and Bank of America, has facilitated over $2.5 billion in trade-finance payments, and has been featured in Bloomberg, the Financial Times, the Wall Street Journal and on Nasdaq. Its prop trading evaluations are simulated and educational.
View author page