One account, every market we offer
Explore all marketsA morning star candlestick is a three-candle bullish reversal that forms at the end of a decline: a tall red candle, a small-bodied candle that sits below it, and a tall green candle that closes at least halfway back up the first candle's body. The morning star candlestick takes three sessions to complete, which is why it is slower and less common than a single-candle signal, and also why it tends to be more dependable.
The name comes from the bright planet that appears in the sky shortly before sunrise. On a chart, the small middle candle is that star: a faint sign that the dark stretch is ending. This guide walks through each of the 3 candles, the exact rules that Steve Nison and Thomas Bulkowski use, why the textbook gap rarely exists in crypto and forex, what the test data says, and a worked trade on Ethereum with entry, stop, target and position size.
Quick answer: A morning star candlestick is a bullish reversal made of 3 candles after a downtrend: a long red candle, a small candle of either colour whose body sits below the first body, and a long green candle that closes above the midpoint of the first candle's body. It shows sellers running out of force and buyers taking over. Traders usually buy on the close of the third candle or on a pullback, with the stop below the lowest point of the pattern.
Highlights of this article
- A morning star needs a prior decline, a tall red candle, a small middle candle and a tall green candle closing past the midpoint of candle 1
- In Bulkowski's tests it acted as a bullish reversal 78% of the time, ranking 6th of 103 candle types for reversal rate
- The textbook gaps around the middle candle are common in daily stocks and rare in crypto and forex, so most traders relax them
- The pattern is already confirmed by its third candle, but the entry comes late and the stop is wide
- The stop belongs below the pattern's low, and position size is calculated from that distance
The three sessions behind a morning star
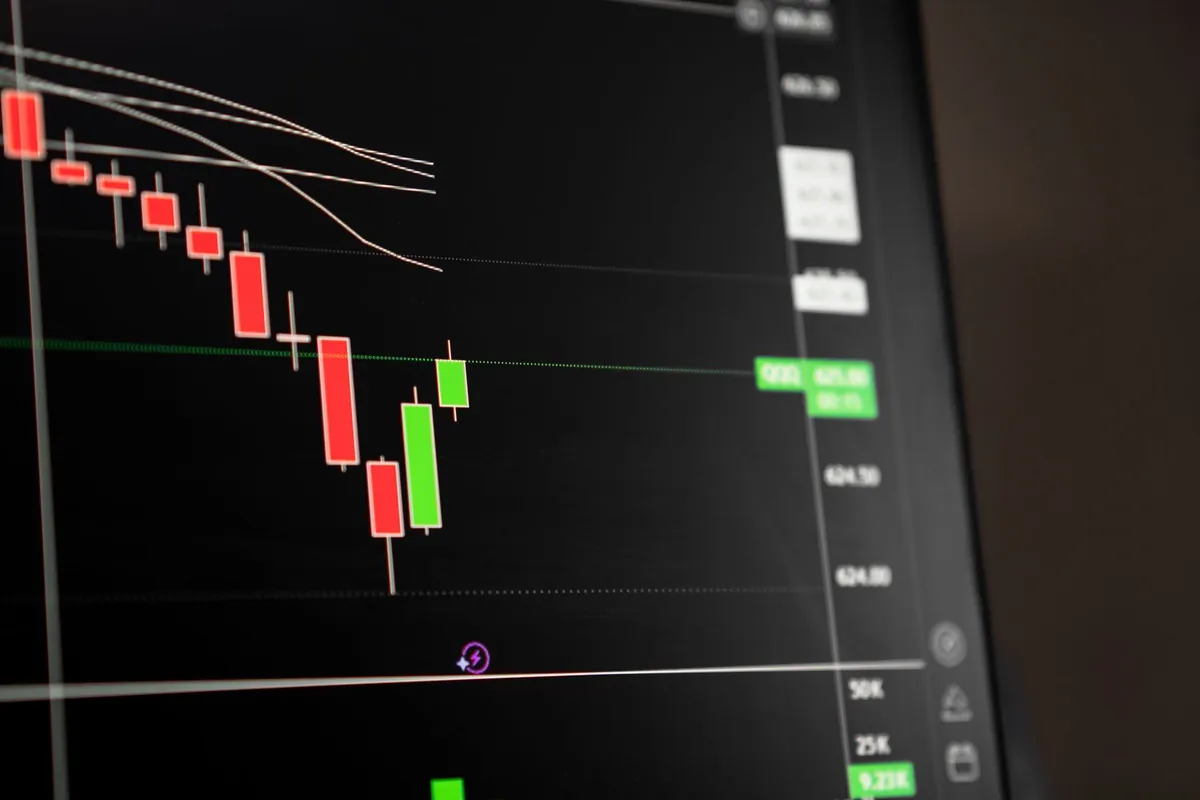
Session 1: sellers in full control. The market has been falling, and this session extends the fall with a tall red candle. It opens near its high and closes near its low. Nothing about this candle suggests a turn.
Session 2: the stall. The next session opens lower, often with a gap on a stock chart, but the body is tiny. Sellers pushed and got almost nothing for it. The colour of this candle does not matter. Its size does.
Session 3: buyers take over. The third session opens above the small candle's body and rallies hard. By the close, the green candle has recovered at least half of session 1's body. Traders who sold during session 1 and session 2 are now sitting on losses, and their buying to exit adds fuel to the move.
That sequence separates it from a single long-wicked candle such as the hammer candlestick, where the whole rejection happens inside one session.
Morning star identification rules
Bulkowski's guidelines on ThePatternSite and the StockCharts ChartSchool description agree on the structure. The table sets out each requirement and how strict it is in practice.
| Element | Textbook rule | In practice |
|---|---|---|
| Prior trend | Downward | Required. Without a decline there is nothing to reverse |
| Candle 1 | Tall red candle | Required. It should be large relative to recent candles |
| Candle 2 | Small body of any colour, gapping below candle 1's body | Small body required. The gap is relaxed in 24-hour markets |
| Candle 3 | Tall green candle that gaps above candle 2's body | Tall green body required. The gap is relaxed in 24-hour markets |
| Close of candle 3 | At least midway into candle 1's body | Required. This is the test most weak patterns fail |
| Shadows | Ignored for the gap test | Bodies define the pattern |
The midpoint rule deserves attention. Take the open and close of candle 1, add them and divide by 2. If candle 3 closes below that level, buyers have not recovered enough ground, and the formation is just a bounce inside a downtrend. The deeper candle 3 closes into candle 1, the stronger the signal.
Planning to trade reversal setups in a prop firm evaluation? Compare the plans before you choose an account size.
The gap problem in crypto and forex
The classic definition comes from daily charts of markets that shut overnight. Overnight orders create gaps, so the small candle can open clearly below the first body, and the third candle clearly above the small one.
Crypto trades around the clock and spot forex trades 24 hours a day, 5 days a week. Each candle opens almost exactly where the previous one closed. If you insist on gaps, you will almost never find a morning star on Bitcoin or EUR/USD.
Most traders use a relaxed version in these markets:
- Candle 2 opens at or near candle 1's close and has a small body near the bottom of candle 1's range.
- Candle 3 opens at or near candle 2's close and closes above the midpoint of candle 1's body.
The relaxed version keeps the logic: sell-off, stall, recovery. The published statistics below were measured on daily US stocks with the strict definition. They do not transfer automatically to a 15-minute Ethereum chart.
Morning star variations
Two close relatives share the same 3-candle sequence. The difference is in the middle candle.
Morning doji star. The middle candle is a doji: open and close are nearly equal. Tradition treats this as the stronger version because indecision is total. Bulkowski's numbers do not support that: the morning doji star reversed 76% of the time against 78% for the standard morning star, and its overall rank is lower. The doji candle guide covers the doji types on their own.
Bullish abandoned baby. The middle candle is a doji that gaps away from both neighbours, shadows included. StockCharts describes the difference this way: the abandoned baby has gaps on both sides of the doji, while the morning star does not need them. It is rare, and in gapless markets it barely exists.
What Bulkowski's tests show
Thomas Bulkowski tested 103 candle types on daily US stock data for his Encyclopedia of Candlestick Charts. These are his published figures, checked against ThePatternSite.
| Pattern | Candles | Tested behaviour | Overall performance rank (of 103) | Frequency rank |
|---|---|---|---|---|
| Morning star | 3 | Bullish reversal 78% of the time | 12 | 66 |
| Morning doji star | 3 | Bullish reversal 76% of the time | 25 | 78 |
| Bullish engulfing | 2 | Bullish reversal 63% of the time | 84 | 12 |
| Hammer | 1 | Bullish reversal 60% of the time | 65 | 36 |
| Bullish harami | 2 | Bullish reversal 53% of the time | 38 | 25 |
Three things stand out.
The reversal rate is high. At 78%, Bulkowski ranks the morning star 6th of 103 for how often it does what theory says. He calls it one of his favourites and considers it reliable.
The move afterwards is good too. An overall performance rank of 12 means the trend after the breakout tends to continue. Compare that with the engulfing candle, which reverses often but ranks 84th for the move that follows.
It is uncommon. A frequency rank of 66 means you will not see one every week. The bullish harami appears far more often and works far less well.
Bulkowski adds a caution on patience. Measured 10 days after the breakout, the upward move is modest. Measured until the trend ends, it is strong. A trader who expects an immediate surge will often exit too early.
In his data the pattern performed best within a third of the yearly low, with tall candles, and during a downward retracement of a larger uptrend. A morning star that ends a pullback in an uptrend has the bigger trend on its side.


A 5-point checklist before you trade one
- Is there a real decline? At least several lower closes before candle 1. A morning star in a sideways range is noise.
- Is the location meaningful? The low of the pattern should sit at or near a level that held before. See the guide to support and resistance for how to mark those zones.
- Are candles 1 and 3 tall? Both should be clearly larger than the average candle of the last 10 to 20 sessions.
- Did candle 3 close past the midpoint? If not, wait or skip.
- Does the reward justify the stop? The stop goes under the pattern's low, which can be far away. Check the risk to reward ratio before you enter, not after.
How to enter, where to stop, what to target
The morning star has a built-in trade-off. By the time candle 3 closes, the signal is confirmed, but price has already travelled a long way from the low. That makes the stop wide.
There are two common entries:
- Close of candle 3. The standard entry. You are certain of a fill and certain the pattern is complete.
- Pullback into candle 3. A limit order near the middle of the third candle's body. The stop distance shrinks, and the reward to risk improves, but the order sometimes does not fill.
The stop goes just below the lowest low of the 3 candles, which is usually the low of the middle candle. If price trades below that point, the stall was not a turn. The stop loss guide explains how to add a buffer for spread and normal noise.
For the target, use the nearest clear resistance above, such as a prior swing high.
Worked example: a morning star on Ethereum
Prices are illustrative. Ethereum falls for 5 sessions on the daily chart into a support zone near 3,400 dollars that held twice in the prior month. Crypto does not gap, so this is the relaxed version of the pattern.
- Candle 1: open 3,620, close 3,452, low 3,440. A red body of 168 dollars.
- Candle 2: open 3,452, high 3,478, low 3,385, close 3,438. A body of 14 dollars at the bottom of candle 1's range.
- Candle 3: open 3,438, high 3,572, close 3,560. A green body of 122 dollars.
The midpoint of candle 1's body is (3,620 + 3,452) ÷ 2, which is 3,536. Candle 3 closed at 3,560, above it. The pattern is valid. Its low at 3,385 dipped under the support zone and price closed back above it, which is the kind of failed breakdown that often marks a turn.
| Entry at candle 3 close | Pullback entry | |
|---|---|---|
| Entry | Buy at 3,560 | Limit buy at 3,500 |
| Stop | 3,370 (15 below the pattern low) | 3,370 |
| Risk per ETH | $190 | $130 |
| Target | 3,870, where the last leg down began | 3,870 |
| Reward per ETH | $310 | $370 |
| Reward to risk | 1.63R | 2.85R |
| Size at $250 risk | 1.32 ETH, about $4,700 notional | 1.92 ETH, about $6,720 notional |
The size line is the important one. The stop is 190 dollars away, so a $250 risk buys only 1.32 ETH.
When a morning star fails
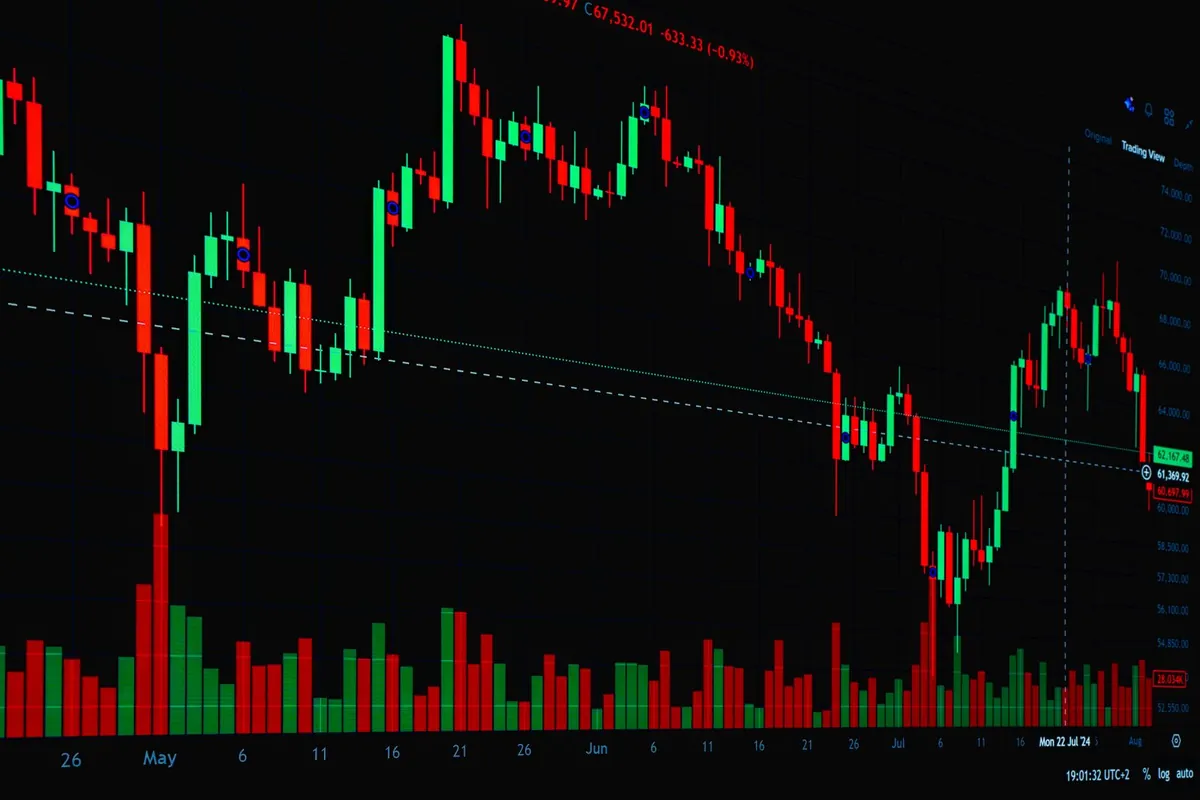
Even at 78% in the test data, roughly 1 in 5 did not reverse, and some that did reverse went nowhere. These are the usual reasons.
- Strong downtrend, no level. In a steep sell-off, a 3-candle bounce is often a pause before the next leg down.
- Weak third candle. A green candle that closes below the midpoint, or with a long upper wick, shows sellers still active overhead.
- Resistance directly above. If a ceiling sits just over candle 3's close, the reward is too small for the stop.
The bearish mirror of this pattern is the evening star candlestick, which forms at the top of a rally. For a single-candle bearish signal, see the shooting star candlestick.
Using the morning star in a prop firm challenge
A morning star is a wide-stop pattern, so the account rules decide how much you can risk on it. Velotrade runs simulated, educational evaluations across crypto, forex, stocks, index ETFs and commodities on DXtrade, with a static maximum drawdown: a fixed dollar floor that does not move as the balance grows.
On a $50,000 CLASSIC 1-Step account, the 7% maximum drawdown puts the floor at $46,500, and the 4% daily loss limit is $2,000 from a $50,000 balance. The Ethereum example risked $250 per trade. At that size, 8 straight losses would reach the daily limit and 14 would reach the floor. A pattern with a strong test record still loses in streaks, and that buffer is what keeps the account alive through one.
This article is educational and is not investment advice. Morning stars fail, and the loss on each trade is the part you control.
For every candle signal in one place, see the full guide to candlestick patterns.
Sources
- Steve Nison, Japanese Candlestick Charting Techniques, 2nd edition (New York Institute of Finance, 2001): the star family of reversal patterns and the origin of the morning star name.
- Thomas N. Bulkowski, Encyclopedia of Candlestick Charts (Wiley, 2008), with results published on ThePatternSite: morning star, morning doji star, bullish engulfing, hammer and bullish harami identification guidelines, test results and ranks.
- StockCharts ChartSchool, "Candlestick Bullish Reversal Patterns": construction of the morning star, the morning doji star and the bullish abandoned baby.
Frequently Asked Questions
About the author

Gianluca Pizzituti
Chief Executive Officer
Formerly on the derivatives desk at Dresdner Kleinwort in London, then founded and ran a proprietary HFT firm in FX and equity indices out of Singapore.
Velotrade was founded in Hong Kong in 2016 by a team from JP Morgan, Dresdner Kleinwort and Bank of America, has facilitated over $2.5 billion in trade-finance payments, and has been featured in Bloomberg, the Financial Times, the Wall Street Journal and on Nasdaq. Its prop trading evaluations are simulated and educational.
View author page