One account, every market we offer
ExploreA golden cross is a bullish chart signal that appears when the 50-day simple moving average crosses above the 200-day simple moving average. It tells you that the recent average price has climbed above the long-term average price, which usually means a downtrend has ended and a new uptrend is underway. The opposite event, the 50-day crossing below the 200-day, is called a death cross.
The golden cross is widely watched, from stock indices to Bitcoin, but it is built from past prices, so it always arrives late. This guide explains why it lags, how traders actually use it, and where it fits among the other chart patterns every trader should know.
Quick answer: A golden cross is a bullish trend signal that occurs when the 50-day simple moving average crosses above the 200-day simple moving average, usually after a decline. The golden cross confirms that a downtrend has given way to an uptrend, and the signal is stronger when price holds above both averages and the 200-day average turns higher.
Highlights of this article
- A golden cross is the 50-day moving average crossing above the 200-day; a death cross is the 50-day crossing below the 200-day
- Both signals lag price by design, so the market low (or high) usually comes well before the cross
- Most traders use the golden cross as a trend filter that tells them which direction to favour, not as an entry trigger
- In sideways markets the two averages tangle and produce repeated false signals, called whipsaws
- On a daily chart, the golden cross is context for a trade; the entry, stop and size still come from price structure and risk rules
Ready to get funded?
Trade up to $200,000 in firm capital with static drawdown, no consistency rule, and payouts within 24 hours. Pass the challenge and keep up to 90% of your profits.
What is a golden cross?
A golden cross is the moment a shorter-term moving average crosses above a longer-term moving average, and the classic version uses the 50-day and 200-day simple moving averages on a daily chart. When the 50-day average rises above the 200-day average, the average price of the last ten weeks or so has overtaken the average price of roughly the last year of trading. That shift is read as evidence that buyers have taken control of the trend.
The chart below shows the idea. Shorter averages are used so the whole move fits on one chart, but the logic is identical to the 50-day and 200-day version.
Look at where the low is. Price bottomed and was already recovering well before the fast average crossed above the slow average, so a good part of the move was done by the time the golden cross printed.
Key facts about the golden cross
| Item | Detail |
|---|---|
| Pattern type | Moving-average crossover; trend-change confirmation |
| Signal | Bullish (golden cross); bearish (death cross) |
| Market context needed | A prior decline or base, followed by price recovering above the long-term average |
| Confirmation | The 50-day closes above the 200-day, price holds above both, and the 200-day flattens or turns up |
| Common entry | Not the cross itself; a pullback toward the 50-day or a break of a nearby swing high after the cross |
| Stop placement | Below the most recent higher low or below the pullback that triggered the entry |
| Measured target | None; the golden cross has no measured move. Use structure, prior highs or a fixed reward-to-risk |
| Main failure mode | Whipsaws in sideways markets, where the averages cross back and forth repeatedly |
What are moving averages?
A moving average is the average closing price over a set number of periods, recalculated each period so the line "moves" with the chart. A 50-day moving average is the average close of the last 50 trading days. A 200-day moving average is the average close of the last 200 trading days. If you are new to reading price, start with our guide on how to read stock charts.
Simple vs exponential moving averages
A simple moving average (SMA) gives every period the same weight, while an exponential moving average (EMA) gives more weight to recent prices. The EMA turns sooner, which can mean an earlier crossover but also more false signals.
The classic golden cross uses simple moving averages. Crossovers with EMAs or other lengths are legitimate variations, but they are different signals and should be tested on their own.
The averages themselves, simple versus exponential and which lengths to use, are covered in our moving averages guide. The MACD is built from the same idea: the gap between a fast and a slow average. The Ichimoku cloud uses midpoint averages of highs and lows in a similar way.
What does a golden cross mean?
A golden cross means the medium-term trend has turned higher relative to the long-term trend. It does not mean price will keep rising, and it does not mean the move is early. It is a confirmation that a change in trend has already happened.
The three phases of a golden cross
Most textbook golden crosses unfold in three phases:
- Decline and base. Price falls, the 50-day average sits below the 200-day, and eventually selling dries up. Price starts to make higher lows and moves sideways or recovers.
- The cross. As the recovery continues, the 50-day average turns up and crosses above the 200-day average. This is the golden cross itself.
- Continuation. If the uptrend is genuine, price keeps making higher highs and higher lows, the 200-day average turns higher, and pullbacks tend to find support near the 50-day average.
Without phase three, the cross is just two lines touching.
Payout proof
Fast, real payouts. Traceable on Arbitrum.
- Paid within 24 hours of approval
- Settled on Arbitrum in USDC or USDT
- Look up any transaction on Arbiscan


Why does the golden cross lag price?
The golden cross lags because both moving averages are built from past prices. The 200-day average in particular includes months of old data, so it turns slowly. For the 50-day to climb above it, price has to recover enough to drag the shorter average up and through the longer one. By then the low is usually weeks or months in the past.
The lag is a trade-off: it filters out many short-lived bounces, but a trader who waits for the golden cross will never buy near the bottom. The chart above shows it: the low and the early recovery happen before the marker.
How do traders use the golden cross?
Most experienced traders use the golden cross as a trend filter, not as an entry trigger. When the 50-day is above the 200-day, a trader might only look for long setups; when it is below, only short setups or none at all.
A practical way to use the golden cross looks like this:
- Read the regime. Is the 50-day above or below the 200-day, and is the 200-day rising, flat or falling?
- Wait for structure. Look for higher highs and higher lows; a break of structure to the upside adds weight.
- Enter on a pullback, not the cross. A pullback toward the 50-day, old resistance turned support, or a continuation pattern such as a bull flag gives a defined entry and a tighter stop.
- Place the stop at structure. Below the most recent higher low or the pullback, not at an arbitrary distance.
- Size from the stop. The position size calculator turns stop distance and risk into a position size.
- Plan the exit. The golden cross has no measured target, so use prior highs or a fixed reward-to-risk ratio.
Limit orders suit pullback entries because the price is set in advance rather than chased. Gianluca Pizzituti, a Velotrade founder, is clear on this: "always limit orders." Our guide to market orders vs limit orders explains the difference.

Why does the golden cross fail in ranging markets?
The golden cross fails most often when a market moves sideways, because the 50-day and 200-day averages flatten out and drift close together. Small swings then push the 50-day above and below the 200-day repeatedly, and none of the crosses lead to a trend. These false signals are called whipsaws.
A few checks help filter whipsaws:
- Slope of the 200-day. A cross while the 200-day still falls steeply is weaker than one where it has flattened or turned up.
- Price location. Price chopping through both averages means a range, not a trend.
- Structure. No higher highs and higher lows means no uptrend, whatever the averages say.
Ranges also produce false breakouts; the liquidity sweep guide explains how those traps work.
What is a death cross?
A death cross is the bearish mirror image of the golden cross: the 50-day simple moving average crosses below the 200-day simple moving average, usually after a rally has faded. A death cross signals that the medium-term trend has turned down relative to the long-term trend. Like the golden cross, the death cross confirms a move that has already started.
In the chart above, the high comes first and price is already falling before the fast average crosses below the slow one. Traders who use the death cross as a filter stop looking for long setups or look for shorts on rallies back toward the averages.
Golden cross vs death cross
| Golden cross | Death cross | |
|---|---|---|
| Definition | 50-day SMA crosses above 200-day SMA | 50-day SMA crosses below 200-day SMA |
| Signal | Bullish trend change | Bearish trend change |
| Typical context | After a decline and base | After a rally and top |
| What it confirms | Recent prices have overtaken the long-term average | Recent prices have fallen below the long-term average |
| Timing | Lags the low | Lags the high |
| Best use | Filter to favour long setups | Filter to favour short setups or reduce long exposure |
| Main risk | Whipsaw in a range; buying late | Whipsaw in a range; selling near a low |
Golden cross examples across markets
Golden cross in stocks and indices
In stocks and stock indices, the golden cross on the daily chart is a common headline signal. On index charts it tends to arrive after a correction has already turned, so it is better read as a sign that the broad trend has recovered than as a fresh buy signal. If you trade index products, our guide on how to trade indices covers the basics.
Golden cross in Bitcoin
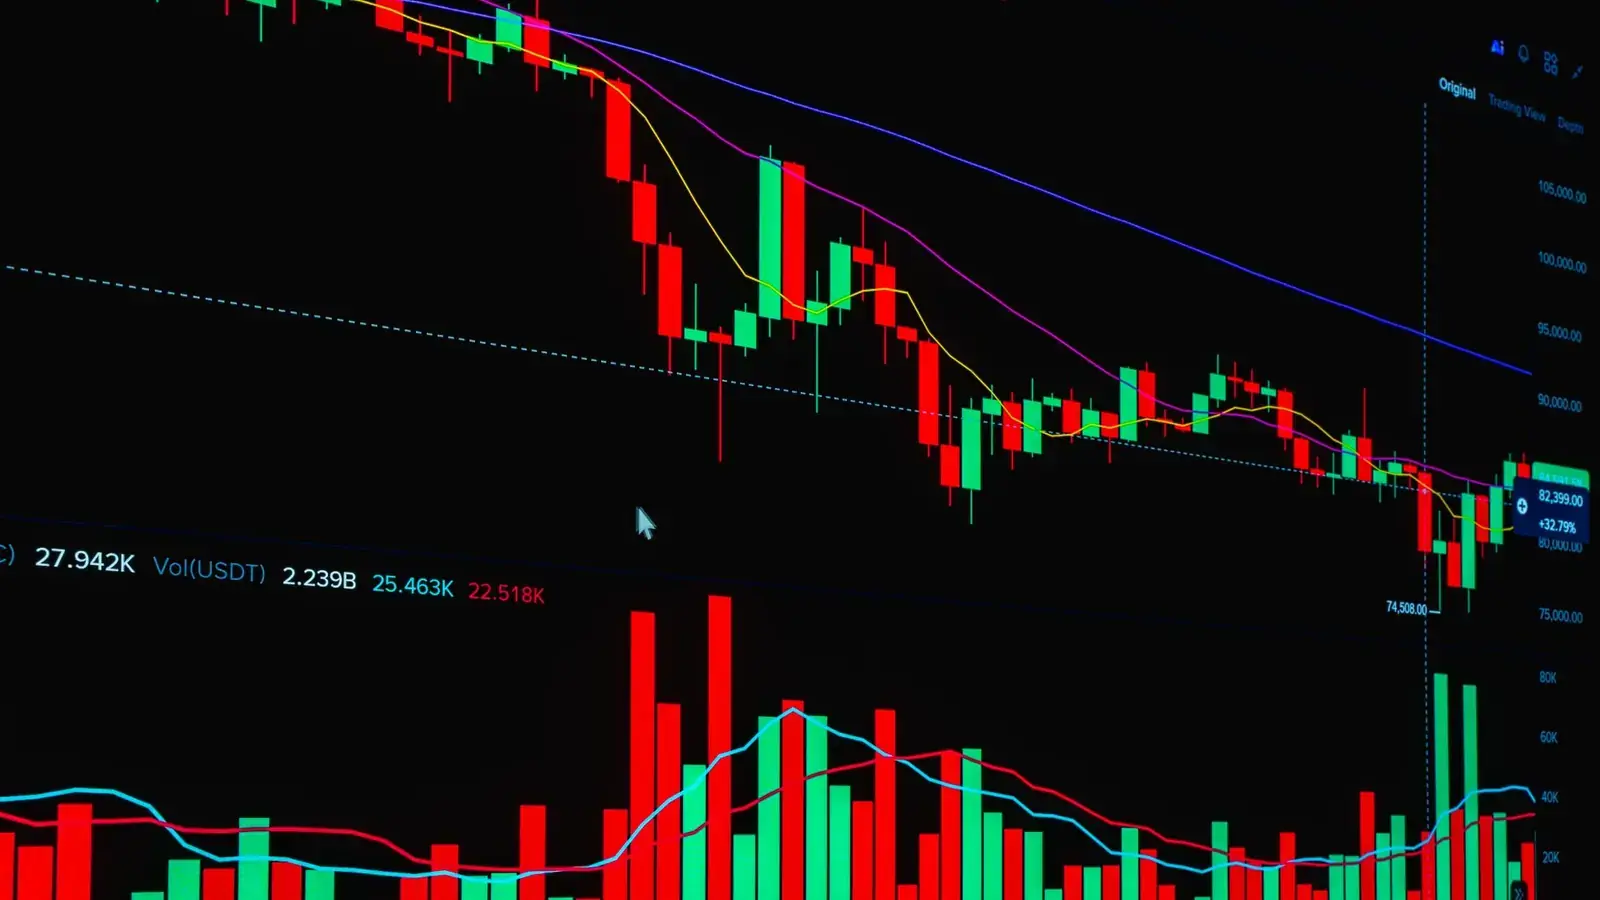
Bitcoin and other crypto assets trade around the clock, so a "50-day" average covers 50 calendar days rather than 50 trading days. Crypto moves fast, so the gap between the low and the golden cross can be large in price terms, and crypto ranges can produce several crosses in a short period.
Moving averages and the bigger picture
The golden cross is a technical signal. Charts are useful, but they are not the whole story. Vittorio De Angelis, a Velotrade founder, puts it this way: charts "condense information about participants' behavior", and fundamentals and flows matter too. Our guide to fundamental vs technical analysis covers how the two fit together.
Can AI detect a golden cross?
Yes, easily, because a golden cross is a precise mathematical event with no ambiguity about whether it happened. Scanners and AI tools can flag golden crosses across thousands of markets in seconds. The hard part is judging which crosses lead to real trends.
That judgement is where AI tools and screeners still produce false positives. A cross in a ranging market looks identical to a cross at the start of a trend. Any rule built on moving-average crossovers should be backtested across different market conditions, and the results still need human judgement. See our guides to AI trading signals and backtesting trading strategies.
Using the golden cross in a prop firm challenge
In a prop challenge, a daily-chart golden cross is a context filter, not a trade trigger. Velotrade, a multi-asset prop trading firm, runs simulated evaluations across crypto, forex, stocks, index ETFs and commodities. On any of them, the golden cross can tell you which direction to favour, but every individual trade still needs a defined entry, a stop at a structural level, and a position size that respects your limits.
Two limits matter most. The daily loss limit resets at 00:30 UTC and is set from the higher of your balance or equity at that time. The maximum drawdown is static: a fixed dollar floor set on your starting balance that does not move. Whipsaw periods can produce several losing trades in a row, so keep risk per trade small enough that a losing run never threatens either limit. The guide to static maximum drawdown explains how the floor works.
Avoid overtrading around the signal: a daily golden cross is not a reason for a flurry of five-minute entries. A profitable trade is not the same as a good trade; what matters is whether it followed your plan. You can compare account sizes and rules on the challenges page.
This article is educational only and is not investment advice.
Frequently Asked Questions
About the author

Vittorio De Angelis
Executive Chairman
Former equity-derivatives trader at JP Morgan, Dresdner Kleinwort and Bank of America in London. Later Head of Brokerage at a global broker in Hong Kong.
View author page


